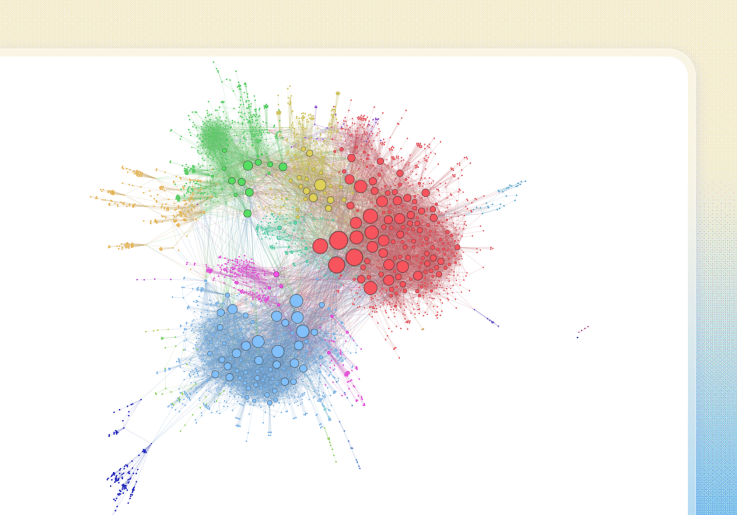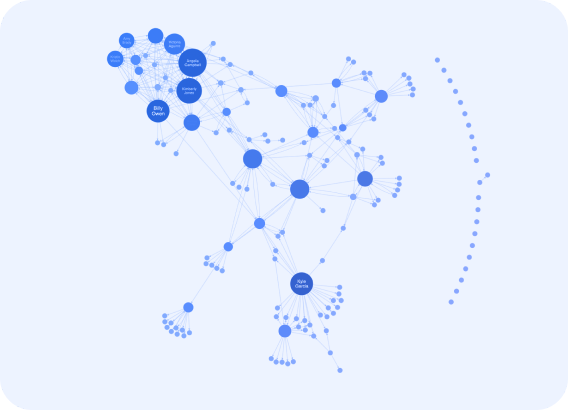
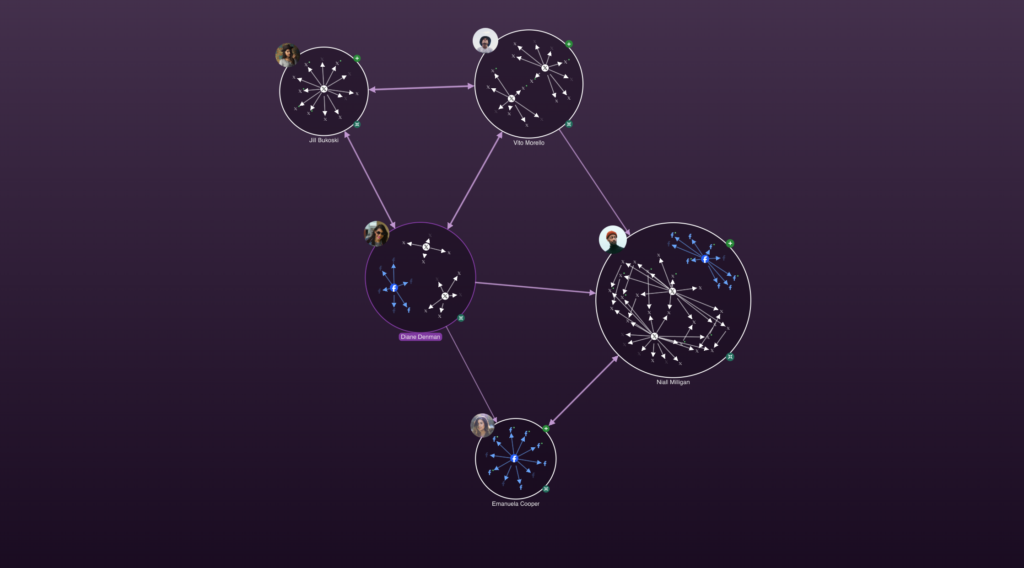
Social Media Analysis
Explore how people are connected based on their social media activity.
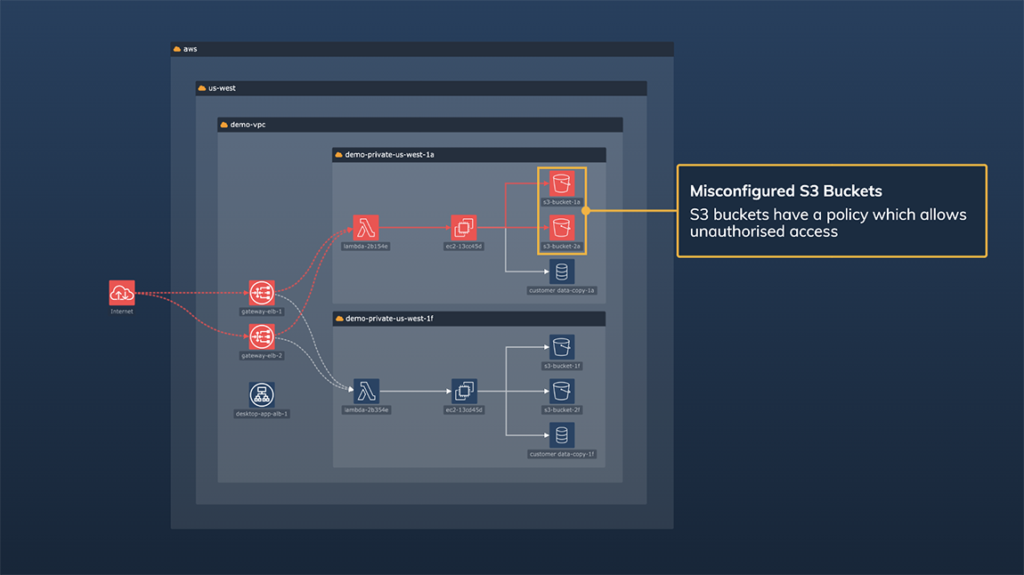
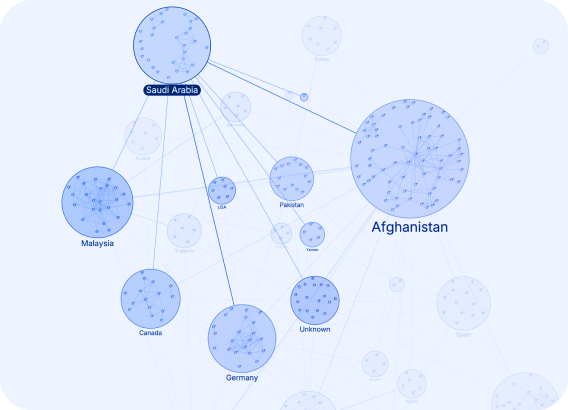
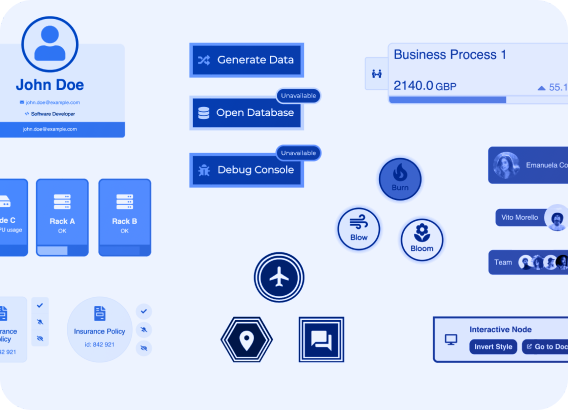
Cloud Security
Alternate between different cloud infrastructure views, and a focussed view of an attack path.
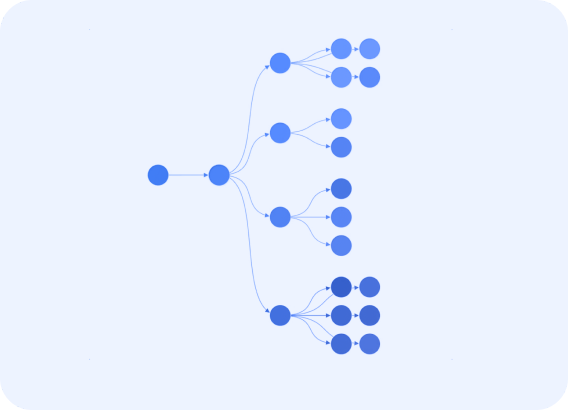
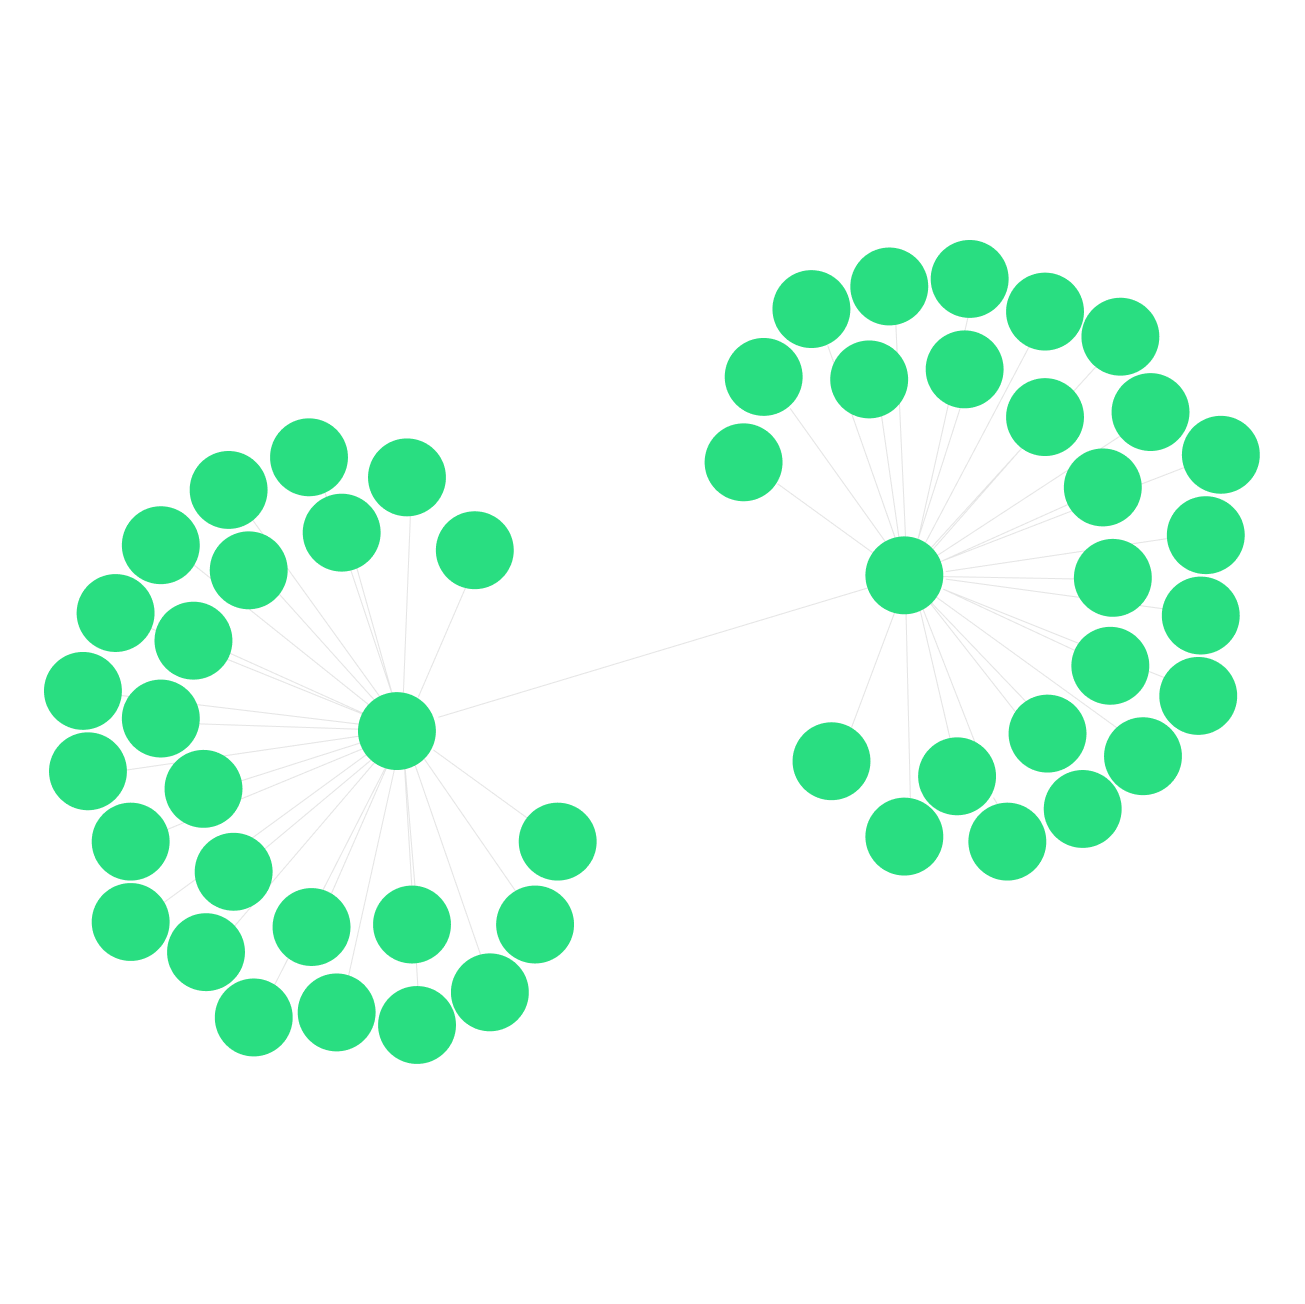
Bitcoin Transactions
Explore bitcoin transactions and entity resolution.