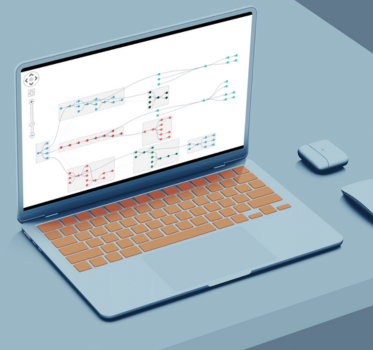
Product update: Smoother and more insightful sequential views
Courtney Collins Product Manager
5th March, 2024 | 2 min read
The latest versions of KeyLines and ReGraph, our graph visualization SDKs, include two hotly-anticipated...
Courtney Collins Product Manager
5th March, 2024 | 2 min read
The latest versions of KeyLines and ReGraph, our graph visualization SDKs, include two hotly-anticipated...
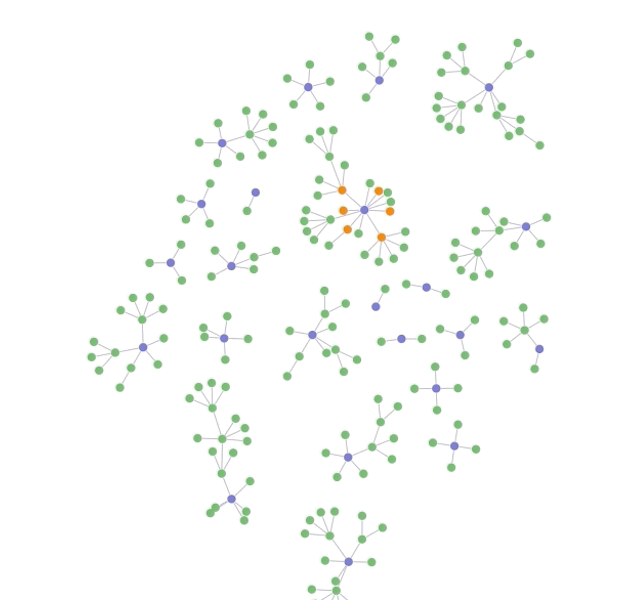
Julia Robson Software Developer
15th June, 2022 | 6 min read
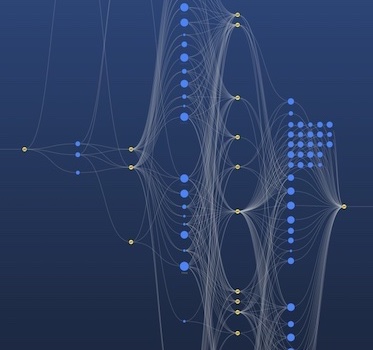
Sequential layout is the best choice for tiered data containing distinct levels of nodes. Find out what makes it...

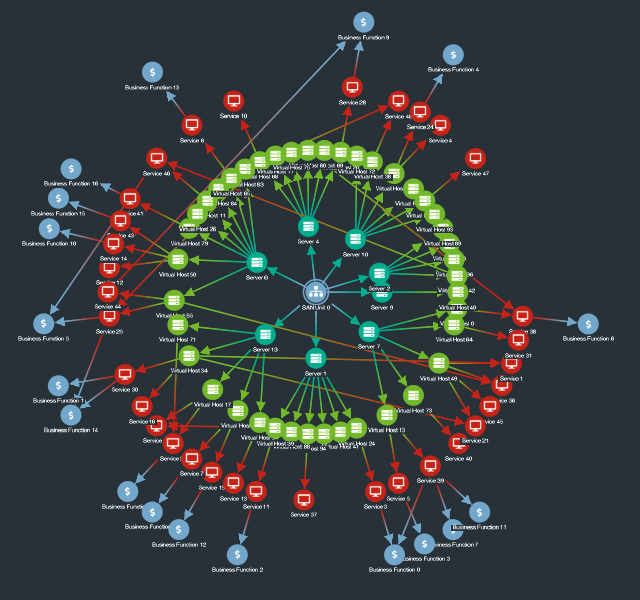
Dan Williams Head of Product Management
5th April, 2022 | 9 min read
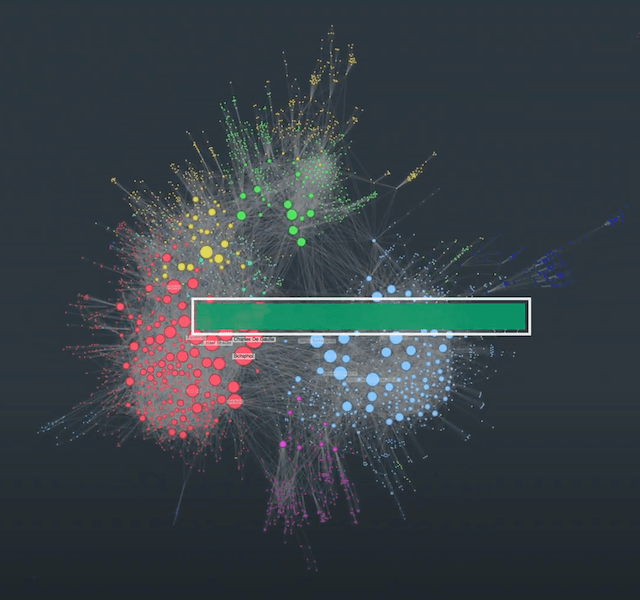
Large network visualization is no problem for our toolkits! We used two of our favorite layouts to map out a...
Dan Williams Head of Product Management
15th March, 2022 | 2 min read
By popular demand, KeyLines 6.9 and ReGraph 3.6, our graph visualization toolkits, give you even more control over...
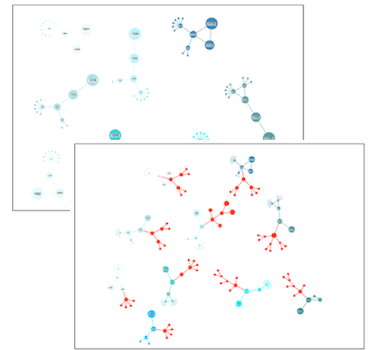
Catherine Kearns Content Strategist & Team Lead
5th May, 2021 | 6 min read
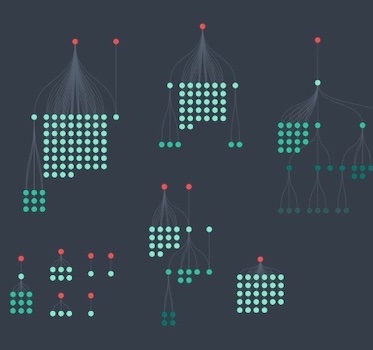
Discover what makes the updated organic layout in our KeyLines and ReGraph toolkits the most powerful, high...
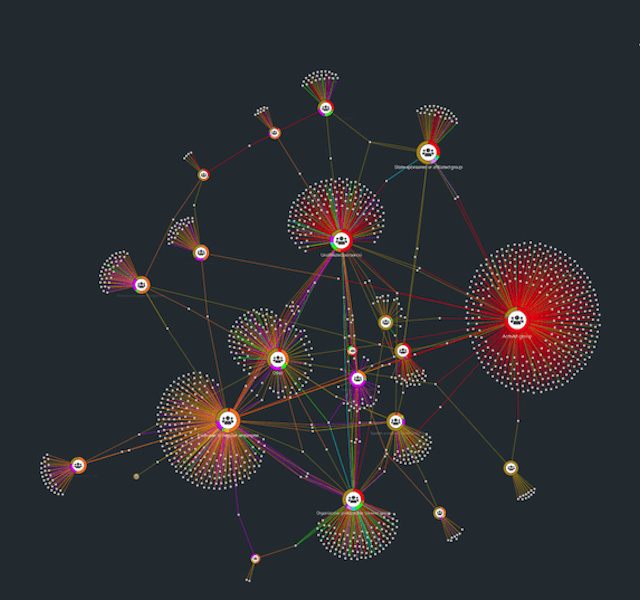
Andrew Disney Marketing Director
26th February, 2021 | 4 min read
We look at the range of automatic graph layouts users rely on to detangle and make sense of their most complex...
Andrew Disney Marketing Director
24th February, 2021 | 5 min read
Graph layouts are key to effective graph visualizations. Let’s examine the forces at work each time we run...
Kevin Naughten Product Manager
23rd June, 2020 | 4 min read
Have you ever built a graph visualization that loaded perfectly, but as soon as you added more data it just...
Roger Murby Software Test Engineer
25th May, 2020 | 6 min read
In this blog post, Roger Murby tells us what life’s like as a software test engineer here, and explains how he...