Data visualization use cases
We help teams overcome complex data visualization challenges
Cybersecurity
Find patterns, anomalies and outliers in your complex threat landscape so you can predict, detect and prevent cyber threats.
Detect cyber threats →
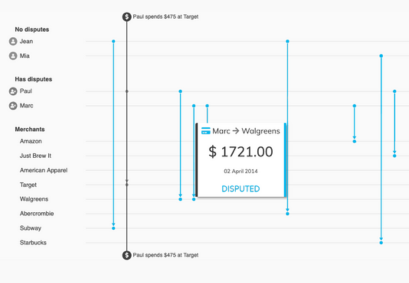
Financial crime & fraud
Analyze connections between people, places, transactions and events to manage compliance and defeat fraudsters.
Tackle financial crime →
Security & Intelligence
Visualize threat information from communications data and intelligence sources to beat organized crime and terrorism.
Uncover security risks →
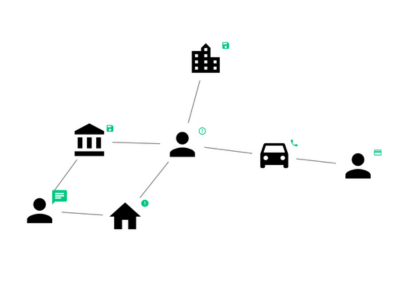
Law enforcement
Equip police and agencies with the tools they need to spot links between suspects, locations, victims and crimes.
Identify criminal connections →
Blockchain & crypto
Simplify blocks of transactions, track the movement of funds and verify crypto users to counteract criminal activity.
See blockchain transactions →
Knowledge graphs
Make large-scale graphs accessible, understandable and intuitive through visual data discovery and interactive analysis.
Explore data at scale →
Pharmaceuticals
Use data visualization to facilitate breakthroughs in scientific understanding, cost efficiences and competitive advantage.
Make sense of pharma data →
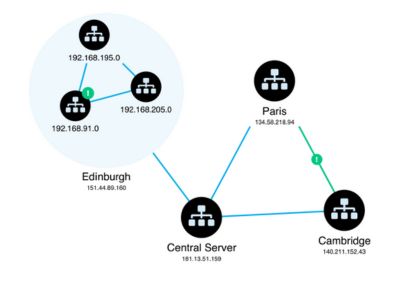
Infrastructure
Map complex systems, networks and pipelines to identify critical paths, prevent bottlenecks and uncover vulnerabilities.
Manage complex networks →
Supply chain
Power end-to-end visibility, efficiency and traceability in supply networks to optimize performance at every stage.
Improve supply chain processes →
