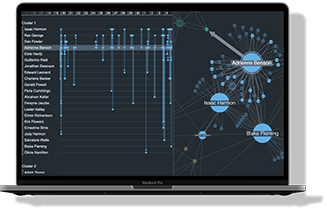
Building a data visualization into your products is about more than just putting information on a screen.
Your visualization is probably part of a larger, carefully-designed, product UI. To give the best possible user experience, your network charts and timelines should fit seamlessly within their parent application. That doesn’t just mean matching colors, icon styles and fonts – you also need to think about workflow elements and how they fit within the context of what your users are doing.
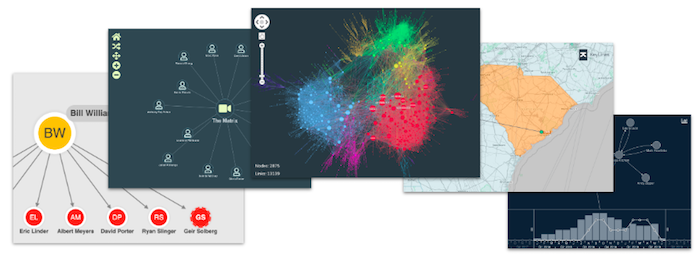
This blog gives you some practical tips and tricks to help you craft a perfect data visualization UI, complete with examples from our network and timeline visualization toolkits.
Don’t settle for the defaults
All toolkits come with default settings, which are fine for prototyping but not right for your finished product. As an example, our JavaScript graph visualization toolkit, KeyLines, comes with default controls for its chart and time bar, and a default white background for the chart. With a few options and some custom controls, we can make a huge difference to the overall impression of the page.
Enhance your chart with UI elements
Your data visualization isn’t a standalone widget, so don’t treat it like one.
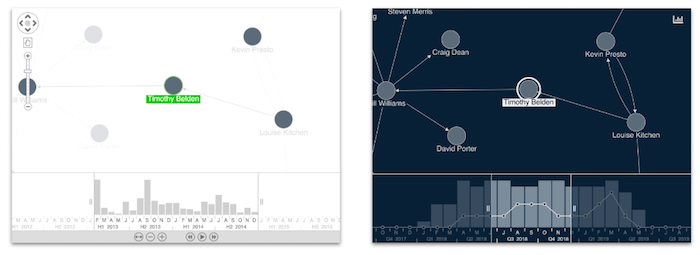
It’s part of your application’s workflow, and you can make it far more visually appealing by adding control buttons, tooltips, overlays, context menus, etc. – all matching the style of your overall product.
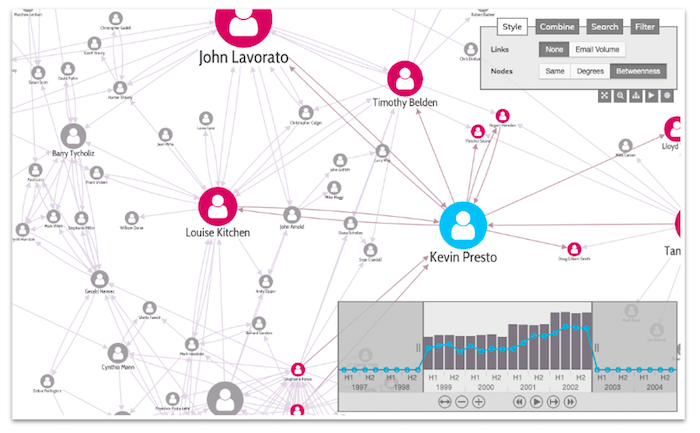
This app has two custom navigation controls in the top left, and a semi-transparent legend and information panel overlaid on the chart:
And on this chart, we’ve overlaid a rich control panel and a time bar:
Think big (and small)
When you’re thinking about the appearance of a network visualization, make sure it can be viewed at different scales. It needs to show detail when zoomed in, but not at the expense of looking terrible when zoomed out.
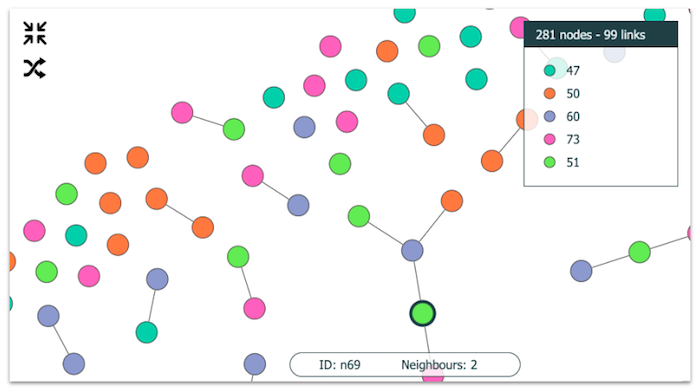
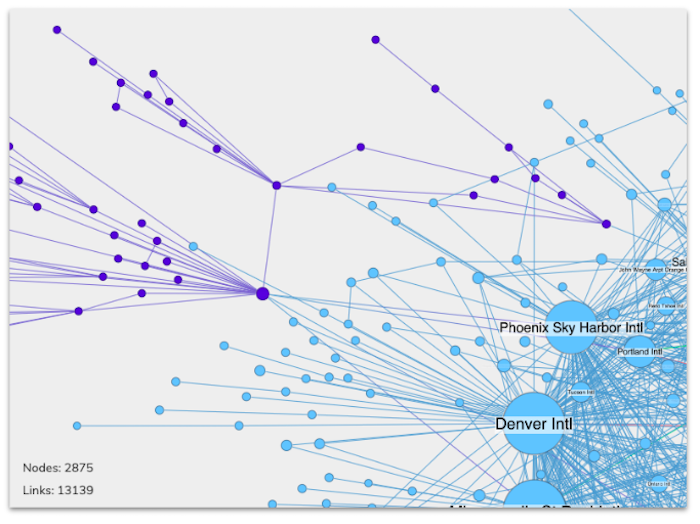
This kind of ‘semantic’ zoom can be difficult to code. Our new adaptive styling feature can help – it intelligently modifies your chart so that it looks good no matter what your zoom level.
Here’s a quick example from a KeyLines chart. A simple call to chart.options({adaptiveStyling: true}) reduces all nodes to simple colored circles, unless they’re big enough to deserve detail. Those larger nodes retain their full appearance, with a label and a border to help them stand out:
Use color carefully
Choosing the right color palette isn’t easy. Our top tip would be to use color for one purpose only.
Consider using color to draw attention to nodes of interest, or use a color scale to show properties like importance or centrality. In our adaptive styling example, above, we used color to convey nodes of a common type, specifically airports in the same continent. Any one of these uses is fine, but your audience could get lost if you use color for multiple purposes in the same chart.
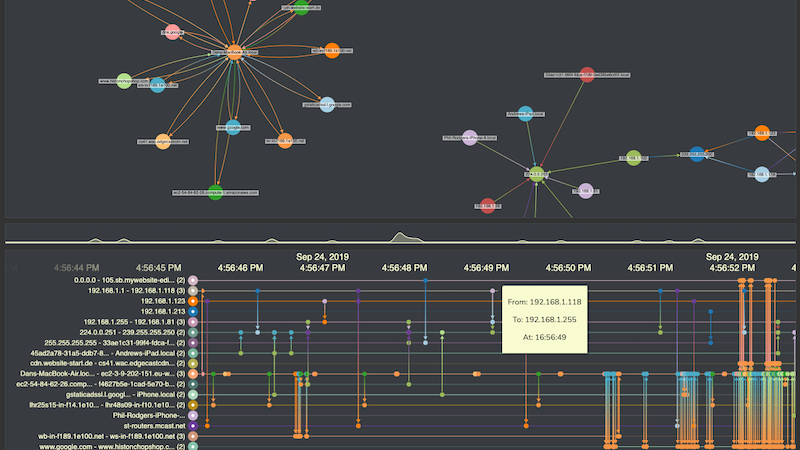
This combined network visualization and timeline visualization example shows the activity that a user’s laptop triggers when it visits a particular website. Here we used distinct colors to draw attention to communications between specific devices on a network.
For more detail on color theory, take a look at our blog on choosing color palettes.
Talk to us!
If you’re trying to achieve a specific look and feel with KeyLines, ReGraph or KronoGraph, and can’t find the level of customization you want, get in touch. We can help you explore just how flexible our custom styling is.
Popular requests include:
- How can I add a shadow effect to my nodes?
- How can I overlay a “mask” on top of nodes to give a strikethrough effect?
- How can I put rounded borders around node labels?
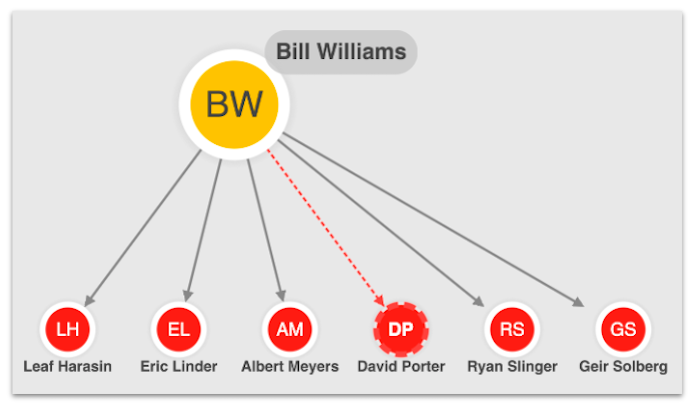
There are solutions to all these problems if you know where to look (see Get more from your graphs with glyphs for some clues).
Apply your own style
Our toolkits come with fully-featured styling demos and example source code, plus every customer has free access to expert support. Our developers are happy to help, no matter how obscure your styling needs might seem.
To experiment with your own styles, go ahead and request a trial.
