Malware investigation tools for cyber analysts
Dan Williams Chief Product Officer
20th November, 2020 | 5 min read
How to build engaging and useful data visualization tools for cyber security analysts, from cyber threat...
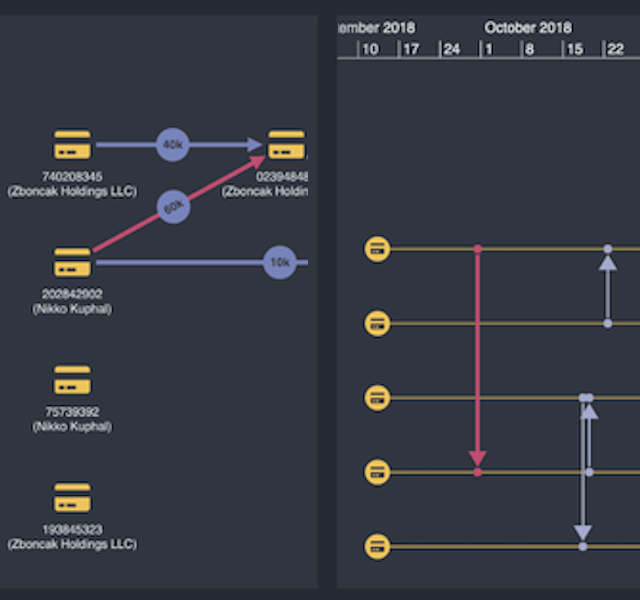
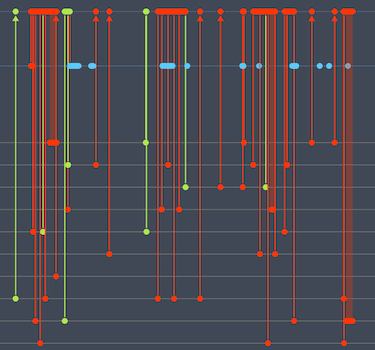
Timeline & graph visualization with KronoGraph and KeyLines
Dan Williams Chief Product Officer
10th November, 2020 | 9 min read
Follow this developer tutorial to build a powerful app for network and time-based data analysis. With detailed...
How to use our timeline visualization React component
Dan Williams Chief Product Officer
20th October, 2020 | 5 min read
React devs: find out how quick and easy it is to build a simple React application using KronoGraph, our timeline...
JavaScript timeline visualization with KronoGraph
Dan Williams Chief Product Officer
22nd September, 2020 | 7 min read
Follow this tutorial to build KronoGraph timeline visualizations with JavaScript. We’ll also analyze James...
5 popular use cases for KronoGraph timeline analysis
Dan Williams Chief Product Officer
15th September, 2020 | 7 min read
Our timeline visualization toolkit, KronoGraph, is for those who want to build rich, interactive timelines into...
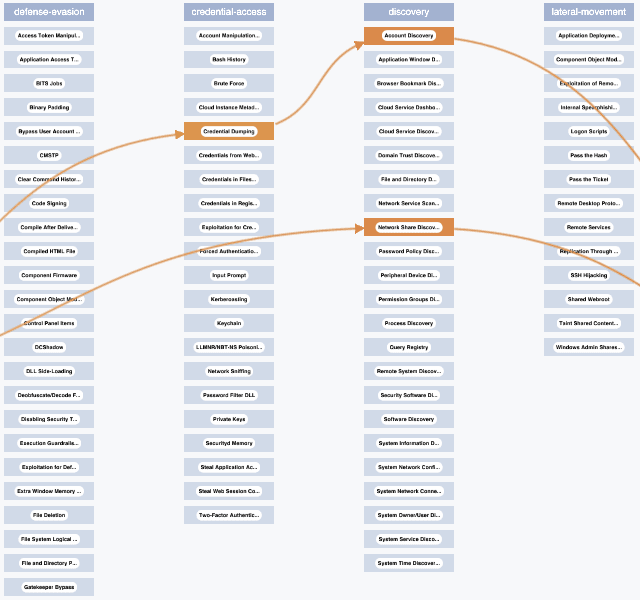
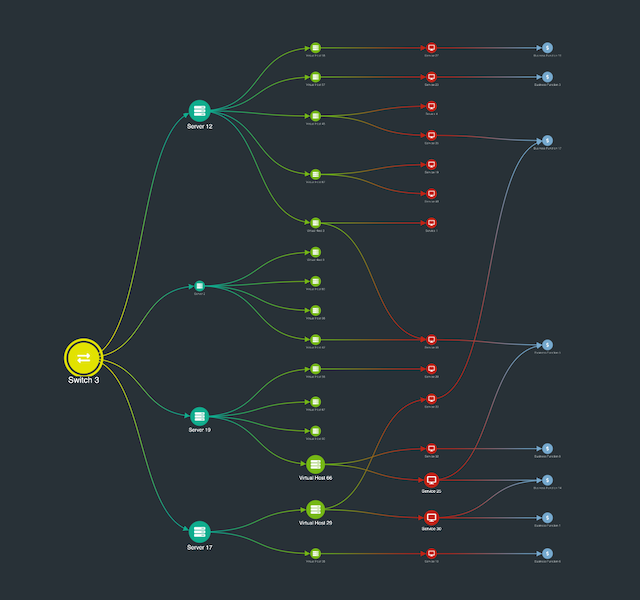
Six essential cyber security analysis tools
Dan Williams Chief Product Officer
11th August, 2020 | 8 min read
With examples from the cyber security world, this blog focuses on six clever customization options in KeyLines and...
Build the best graph visualization user experience
Dan Williams Chief Product Officer
22nd July, 2020 | 3 min read
We’re excited to release KeyLines 6.0 – the latest major version of our graph visualization toolkit for...
Data cleansing with graph visualization
Dan Williams Chief Product Officer
6th April, 2020 | 7 min read
The first step in the data cleansing process is understanding where data quality issues exist. In this blog post...

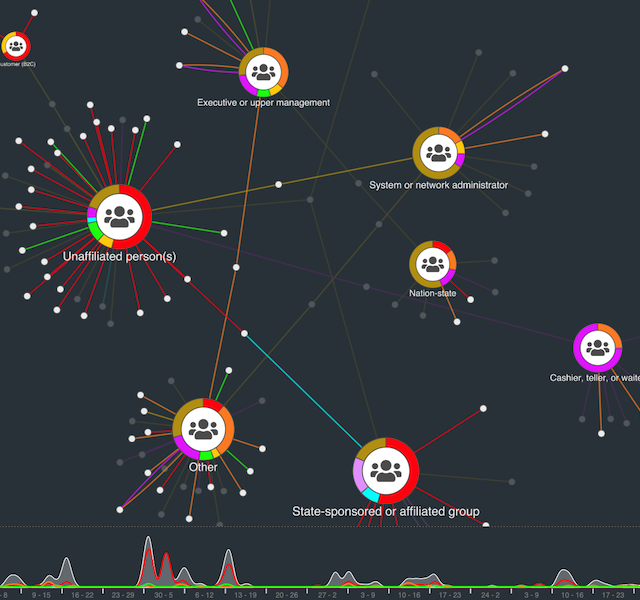
Graph visualization: dealing with starbursts
Dan Williams Chief Product Officer
20th January, 2020 | 8 min read
A starburst is when one heavily connected node dominates your graph visualization. It’s a common problem...
