
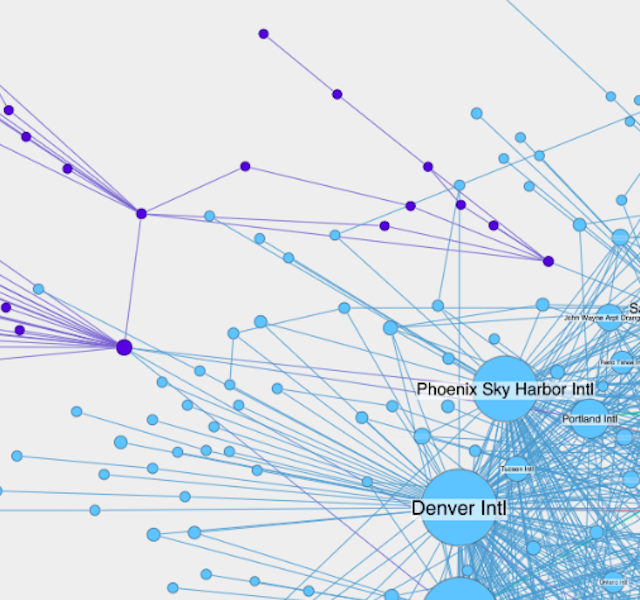
Graph visualization: see through the snowstorm
Dan Williams Chief Product Officer
16th December, 2019 | 7 min read
When you visualize data from spreadsheets and relational databases, how do you prevent the ‘snowstorm’...

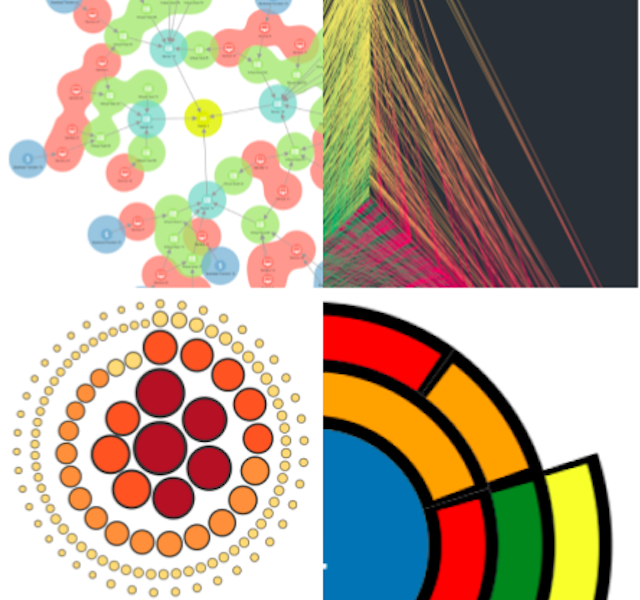
Graph visualization: fixing data hairballs
Dan Williams Chief Product Officer
25th November, 2019 | 6 min read
Learn how to tackle the hairballs in your graph visualizations, where nodes and links are so densely connected you...
Get the perfect look & feel for your data visualizations
Dan Williams Chief Product Officer
17th June, 2019 | 5 min read
How to build great graph visualization tools that fit seamlessly inside your existing applications, matching...
Why we love innovative Friday Projects
Dan Williams Chief Product Officer
24th April, 2019 | 4 min read
This blog explores our Friday Projects initiative. Every Friday, the development team get to work on anything that...
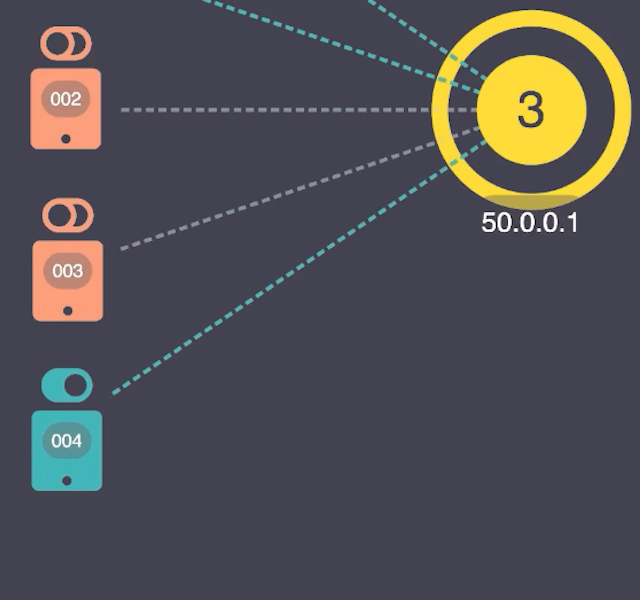
Get more from your graphs with glyphs
Dan Williams Chief Product Officer
8th April, 2019 | 4 min read
This blog shows five of our favorite uses for glyphs to help breathe new life into your network visualization...
5 quirky ways to style combos for maximum impact
Dan Williams Chief Product Officer
18th February, 2019 | 5 min read
Combos are great for reducing clutter and organizing your networks into something more manageable. This blog...
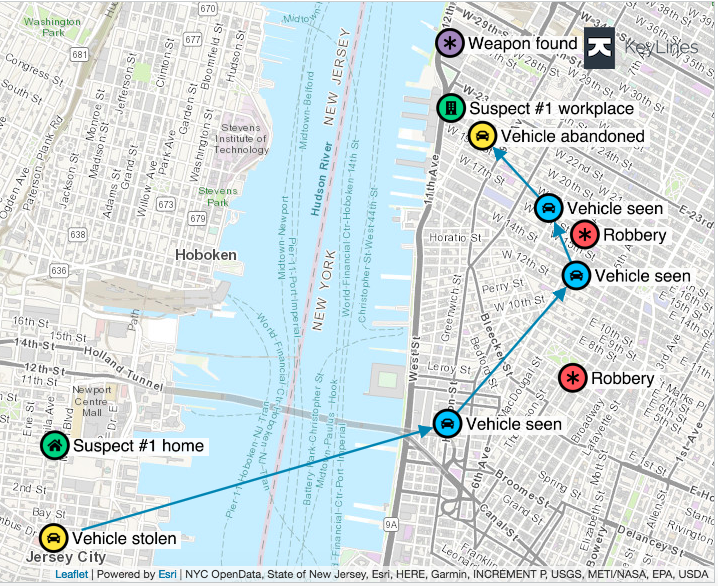
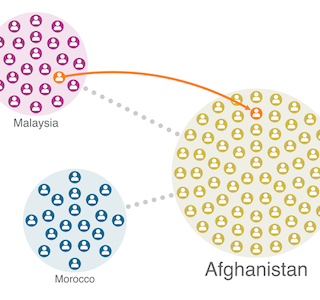
Geospatial graph insight without limits
Dan Williams Chief Product Officer
20th November, 2018 | 2 min read
Cambridge Intelligence, creators of connected data visualization tools that make the world safer, today announced...
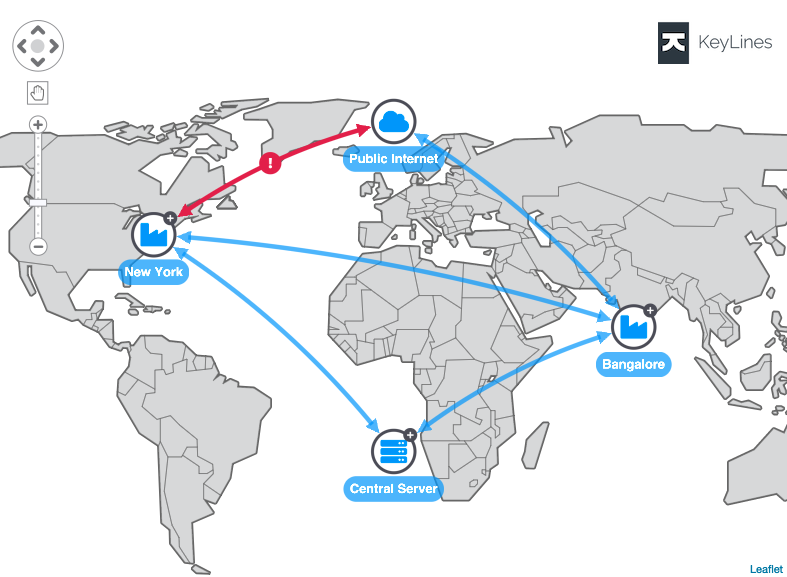
KeyLines 5.0: Geospatial layout & more
Dan Williams Chief Product Officer
20th November, 2018 | 2 min read
We’re excited to announce the release of KeyLines 5.0: the next generation in visualizing connections in...
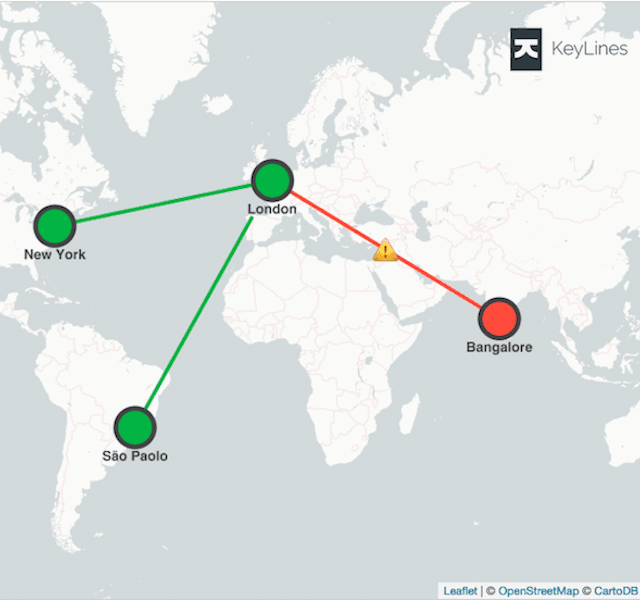
Create a map visualization with KeyLines and Neo4j geospatial data
Dan Williams Chief Product Officer
17th October, 2018 | 7 min read
With KeyLines and Neo4j graph database integrations, exploiting geospatial data has never been easier. Discover...
