How we predicted the World Cup result
Dan Williams Chief Product Officer
18th July, 2018 | 5 min read
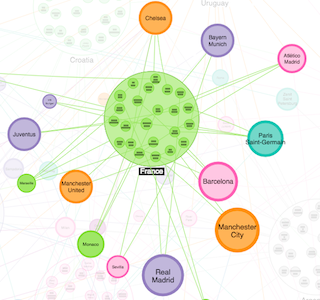
We take a closer look at how we used graph theory to predict France as the 2018 FIFA World Cup winners....
Can graph theory predict the World Cup winner?
Dan Williams Chief Product Officer
29th June, 2018 | 4 min read
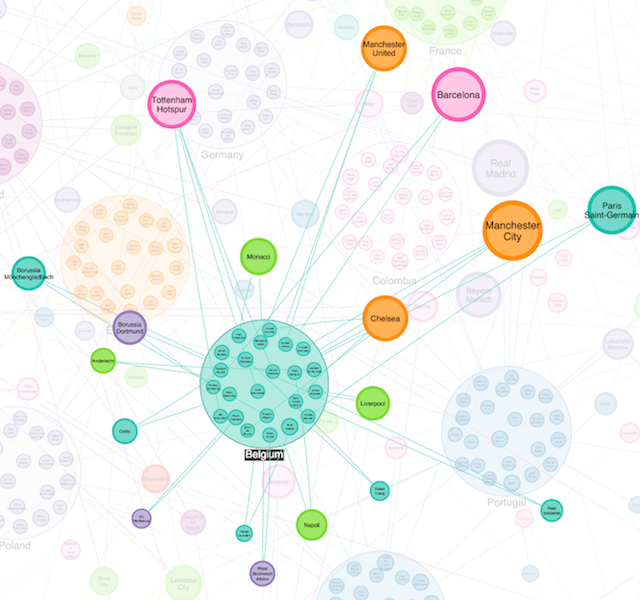
We hear a lot of success stories about how graph theory can make stunning predictions. In this blog post we test...
Visualizing the 2018 World Cup
Dan Williams Chief Product Officer
25th June, 2018 | 3 min read
With the World Cup in full swing, we thought it would be fun to visualize it using our graph visualization...
Choosing a graph visualization partner
Dan Williams Chief Product Officer
16th April, 2018 | 6 min read
We look at three high-level questions you should consider when choosing a graph visualization partner, to make...
Network alert and network topology visualization
Dan Williams Chief Product Officer
12th March, 2018 | 5 min read
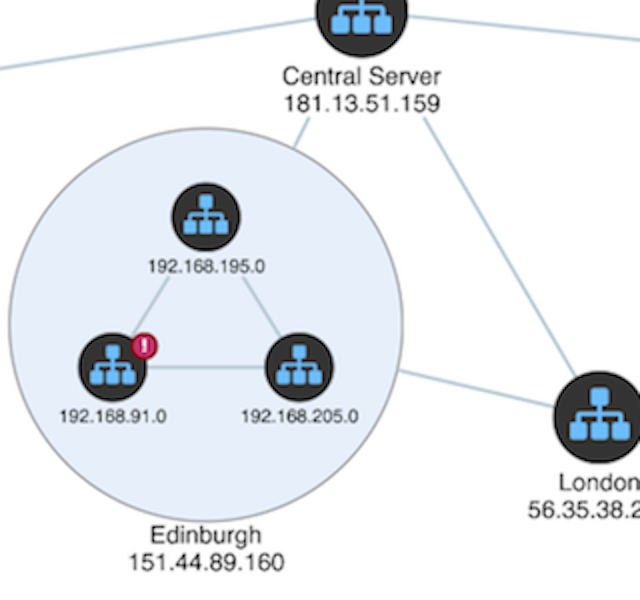
In this blog post, we’ll show you how network visualization can make alert detection and investigation more...
Open source graph visualization: is this the right option for your project?
Dan Williams Chief Product Officer
9th February, 2018 | 6 min read
In this blog post we explore open source code libraries versus commercial SDKs to show why Cambridge...
Visualizing restricted substances for REACH compliance
Dan Williams Chief Product Officer
13th June, 2017 | 6 min read
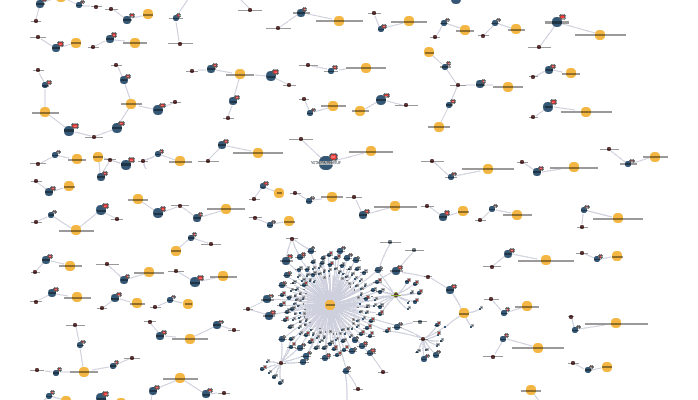
Using connected data visualization techniques to manage supply chain risk, ensure restricted substance compliance...
Angular graph visualization with KeyLines
Dan Williams Chief Product Officer
8th May, 2017 | 4 min read
How to get started with KeyLines and Angular. Build your own advanced graph visualization app using the KeyLines...

