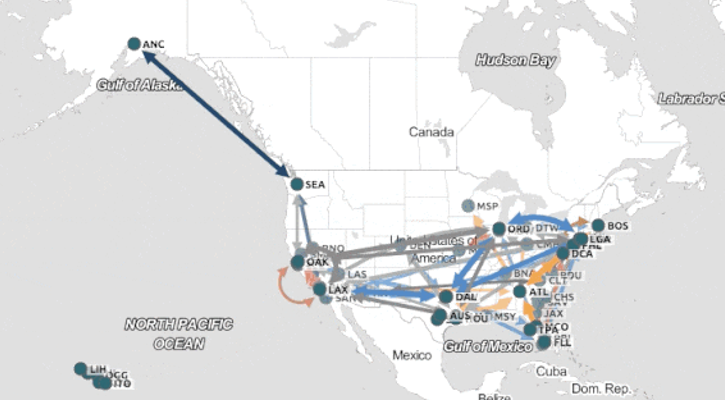
Geospatial graph data visualizations
Adrian Meredith Developer
2nd July, 2015 | 2 min read
This page is from our blog archive It’s still useful, but it’s worth checking out this page on...
Adrian Meredith Developer
2nd July, 2015 | 2 min read
This page is from our blog archive It’s still useful, but it’s worth checking out this page on...

Andrew Disney Marketing Director
27th May, 2015 | 4 min read
32 million business and political relationships analyzed and visualized using KeyLines and Neo4j First KeyLines...

Andrew Disney Marketing Director
21st April, 2015 | 2 min read
Cambridge Intelligence, a firm that is helping to solve some of the world’s most complex data visualisation...

Marco Liberati Developer
26th March, 2015 | 4 min read
Writing front-end code in JavaScript can be tricky. The quality of your code not only affects the visual...
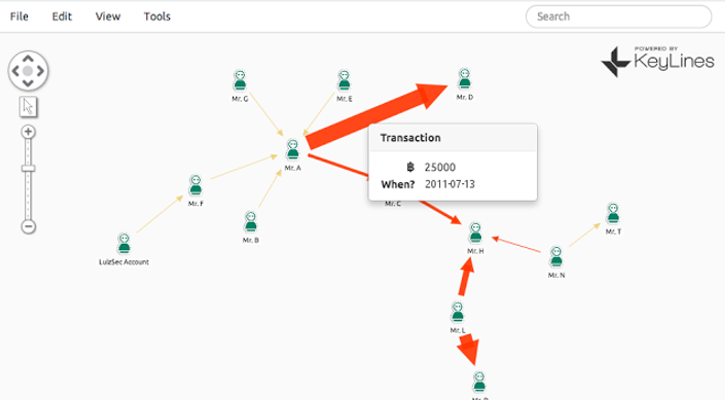
Andrew Disney Marketing Director
23rd March, 2015 | 4 min read
Why visualize financial transactions? Our toolkits are for visualizing networks (or graphs) in data. Transactions...

Andrew Disney Marketing Director
6th March, 2015 | 3 min read
This page is from our blog archive It’s still useful, but check out customer 360 use cases for more...
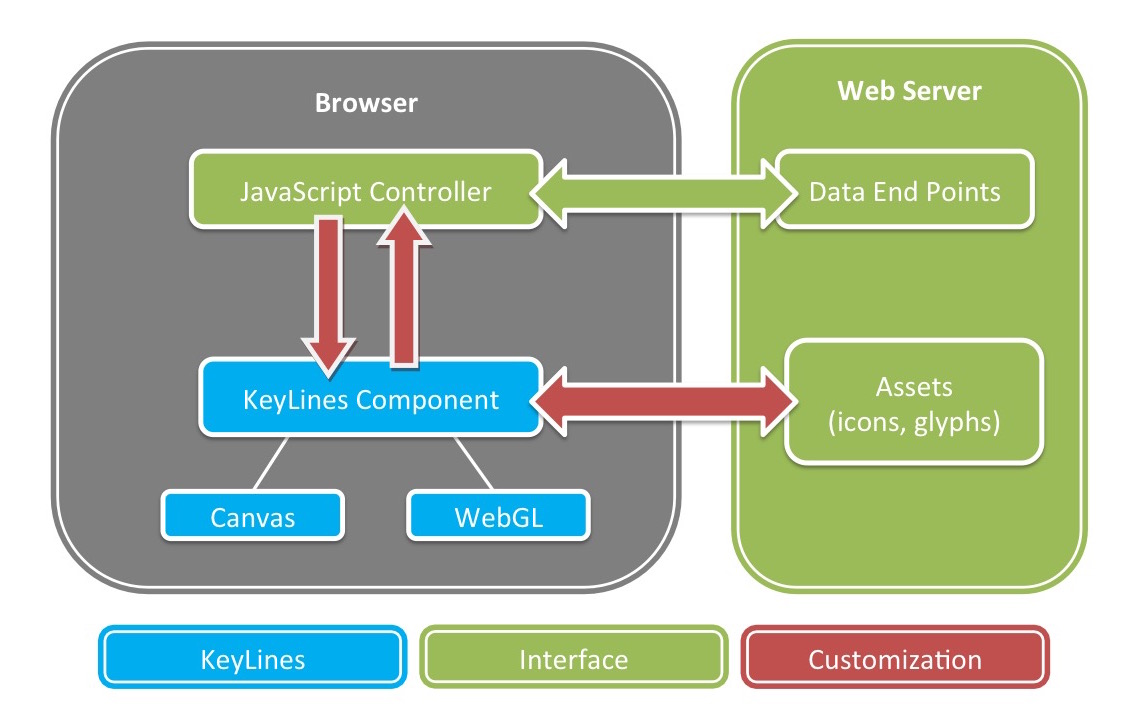
Phil Rodgers Software Developer
28th January, 2015 | 5 min read
This page is from our blog archive It’s still useful, but check out KeyLines architecture for more...

Duncan Grant Sales Engineer
20th January, 2015 | 8 min read
A slightly belated happy New Year to all of you reading this blog post! We hope 2015 is a fantastic year for you...

Andrew Disney Marketing Director
16th January, 2015 | < 1 minute
Joe Parry, the original creator of KeyLines and founder of Cambridge Intelligence, joined the UK Prime Minister...