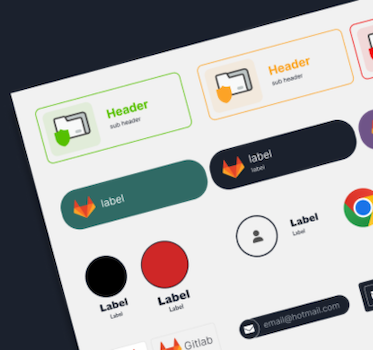
Better data visualization UX design: Introducing our Figma Design Kit
Clare Haynes Product Designer
4th February, 2025 | 3 min read
Good user experience (UX) design is the foundation of a successful data visualization experience. It lets users...
Clare Haynes Product Designer
4th February, 2025 | 3 min read
Good user experience (UX) design is the foundation of a successful data visualization experience. It lets users...
Jan Girman Product Manager
23rd January, 2025 | 2 min read
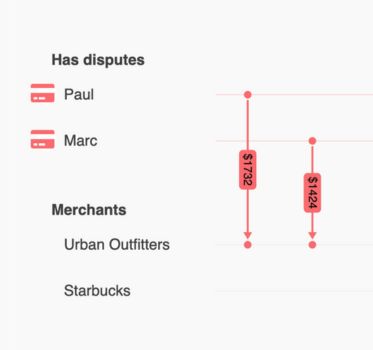
We’ve just released KronoGraph 3.3, with fully customizable labels for event lines, to add clarity to your...

Courtney Collins Product Manager
22nd October, 2024 | 9 min read
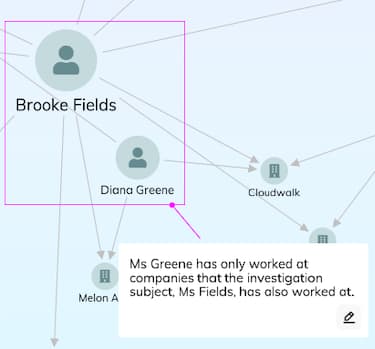
At every stage of an investigation workflow, the analysts need to understand the underlying story – or...
Courtney Collins Product Manager
15th October, 2024 | 4 min read
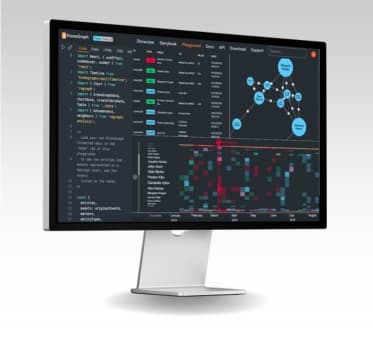
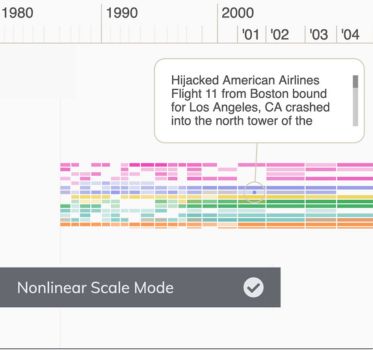
Get ready to tell the story of your complex data – our latest major releases mark a big leap forward in the...
Bonney O'Hanlon Product Manager
5th September, 2024 | 2 min read
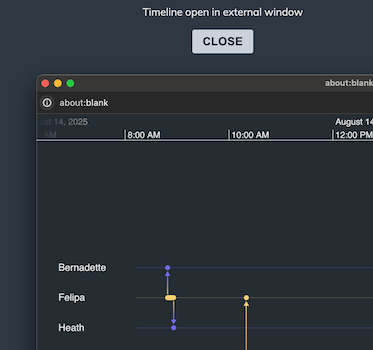
The latest version of KronoGraph, our timeline analytics toolkit, features something unique. For the first time,...
Dan Williams Chief Product Officer
6th August, 2024 | 8 min read
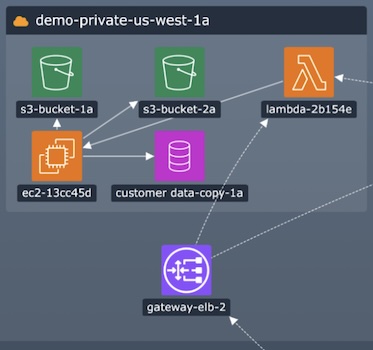
We look at six key areas of rapid change, and how successful organizations use link analysis techniques to keep...
Bonney O'Hanlon Product Manager
23rd July, 2024 | 7 min read
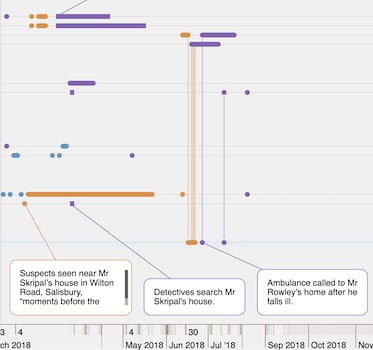
We create a crime data visualization to analyze the people, places and events involved in a real UK Counter...
Bonney O'Hanlon Product Manager
16th July, 2024 | 4 min read
We’ve just released KronoGraph 3.0 – a new major version of our timeline analytics toolkit – with a...
Bonney O'Hanlon Product Manager
16th April, 2024 | 2 min read
When analysts and investigators use apps built with our toolkits, we aim to give them the best user experience. In...
Registered in England and Wales with Company Number 07625370 | VAT Number 113 1740 61
6-8 Hills Road, Cambridge, CB2 1JP. All material © Cambridge Intelligence .
Privacy Policy | Security Framework
