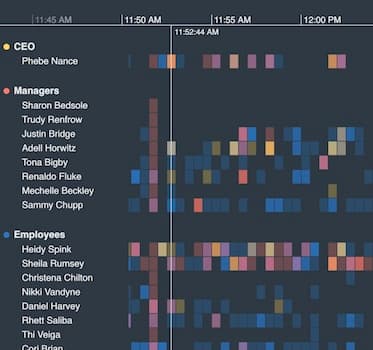
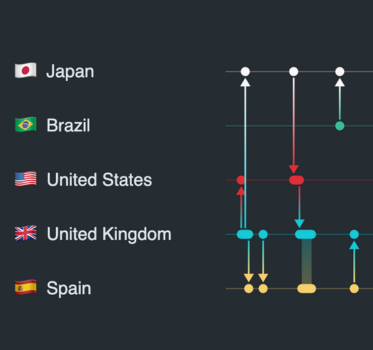
Product update: reveal event times at any zoom level
Bonney O'Hanlon Product Manager
7th March, 2024 | 2 min read
The latest version of KronoGraph, our timeline visualization toolkit, makes it easier to reveal detailed timings...
Bonney O'Hanlon Product Manager
7th March, 2024 | 2 min read
The latest version of KronoGraph, our timeline visualization toolkit, makes it easier to reveal detailed timings...

Catherine Kearns Content Strategist & Team Lead
20th February, 2024 | 8 min read
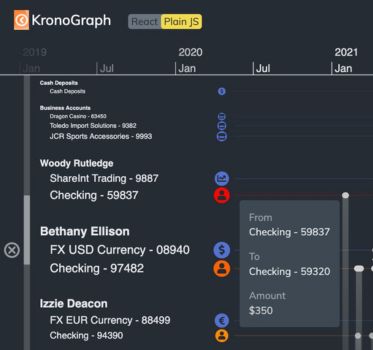
There’s a lot more to credit card fraud visualization than just spotting disputed transactions. To be effective,...
Bonney O'Hanlon Product Manager
19th December, 2023 | 2 min read
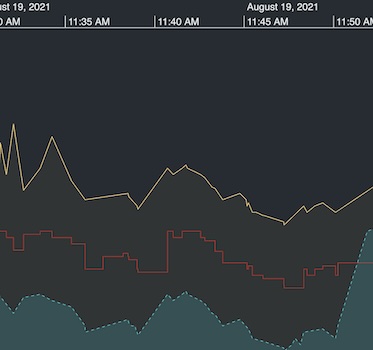
The latest version of KronoGraph, our timeline analysis SDK, sees time series charts move out of beta development...
Corey Lanum Chief Product Evangelist
14th November, 2023 | 15 min read
In this tutorial, you’ll find out how to use Neo4j and KronoGraph to create an interactive timeline...
Bonney O'Hanlon Product Manager
17th October, 2023 | 2 min read
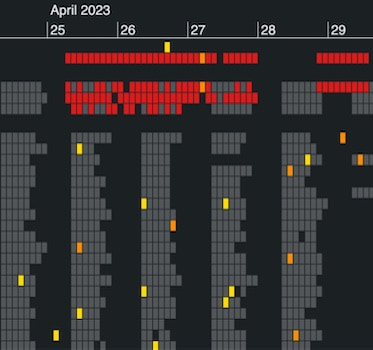
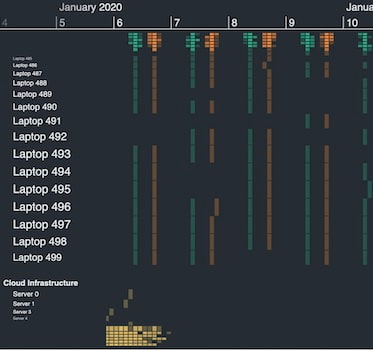
The latest version of KronoGraph, our timeline visualization SDK, includes more ways to customize heatmap cells...
Bonney O'Hanlon Product Manager
22nd August, 2023 | 3 min read
The latest updates to KronoGraph, our timeline visualization toolkit, demonstrate how to emphasize the most...
Dan Williams Chief Product Officer
26th July, 2023 | 6 min read
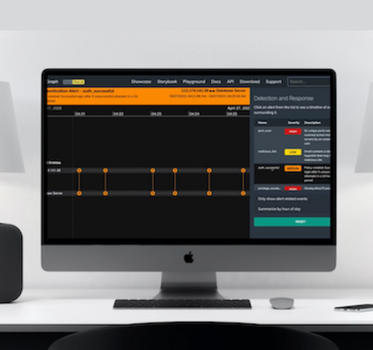
Timeline visualization gives cybersecurity analysts a scalable and intuitive way to investigate threat data, and...
Bonney O'Hanlon Product Manager
4th July, 2023 | 3 min read
KronoGraph 2.5 – the latest version of our timeline visualization toolkit – is now available to...
Bonney O'Hanlon Product Manager
18th May, 2023 | 4 min read
KronoGraph 2.4 introduces duration markers and enhanced styling options to make the important characteristics of...
Registered in England and Wales with Company Number 07625370 | VAT Number 113 1740 61
6-8 Hills Road, Cambridge, CB2 1JP. All material © Cambridge Intelligence .
Privacy Policy | Security Framework
