See time-based analysis through a new lens
Catherine Kearns Content Strategist & Team Lead
11th October, 2022 | 7 min read
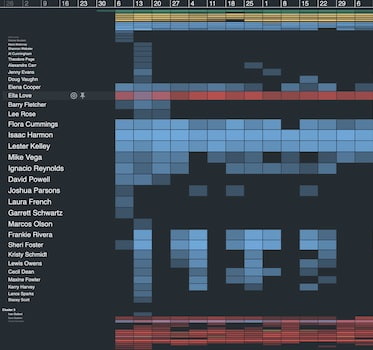
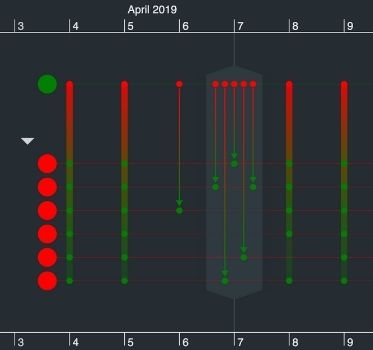
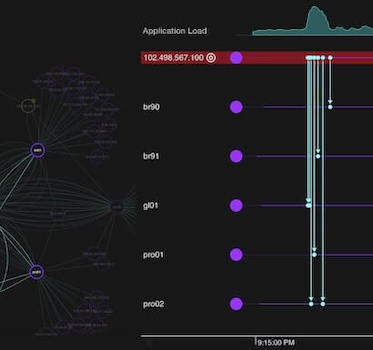
This post shows how unique navigation features in KronoGraph, our time-based visual analytics SDK, help analysts...
Catherine Kearns Content Strategist & Team Lead
11th October, 2022 | 7 min read
This post shows how unique navigation features in KronoGraph, our time-based visual analytics SDK, help analysts...
Matt Latham Product Manager
5th October, 2022 | 4 min read
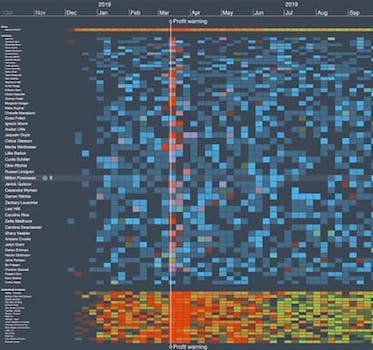
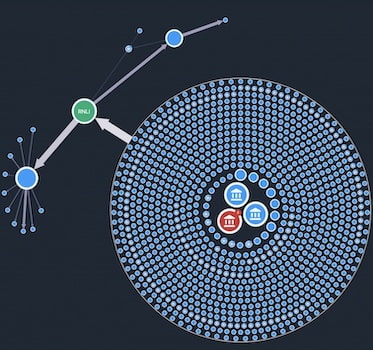
Learn about KronoGraph 2.0: the only timeline analysis tool that lets users combine thousands of timelines into a...
Dan Williams Chief Product Officer
16th August, 2022 | 8 min read
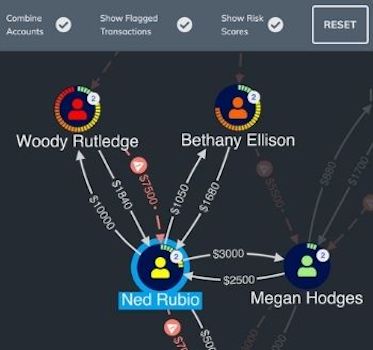
Want to know how to do timeline data modeling? We explore best practices with real-world examples of the best...
Andrew Disney Marketing Director
5th July, 2022 | 7 min read
In this blog post, we’ll see how C3 AI – the enterprise AI pioneers – uses graph and timeline...
Matt Latham Product Manager
24th May, 2022 | 4 min read
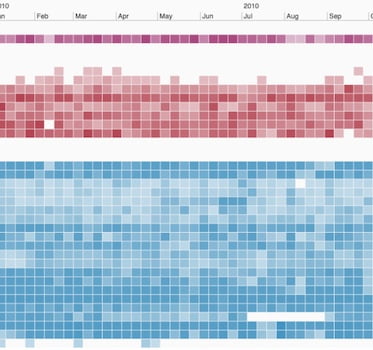
The latest KronoGraph versions offer some visually stunning features and enhancements to inspire your...
Matt Latham Product Manager
10th May, 2022 | 7 min read
We use bitcoin visualization to track how one charity’s clever cryptocurrency activity boosted donation values...
Matt Latham Product Manager
4th May, 2022 | 8 min read
Remember the WannaCry ransomware attack? Launched in May 2017, it was one of the most devastating and extensive...
Matt Latham Product Manager
4th March, 2022 | 2 min read
We’ve recently released new feature-rich versions of KronoGraph, our timeline visualization toolkit. Our...
Thomas Chan Software Developer
25th January, 2022 | 12 min read
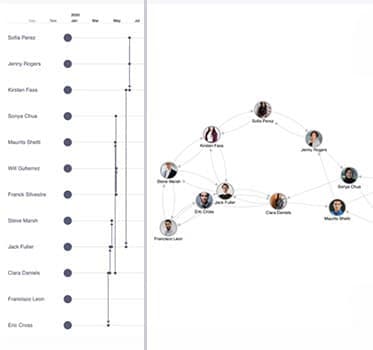
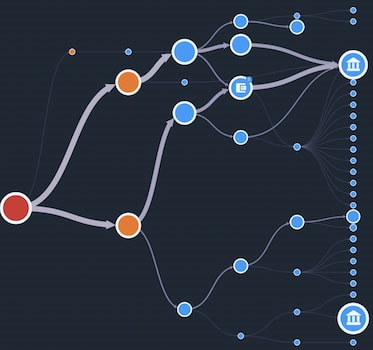
Our updated guide to building a custom root cause analysis timeline and graph visualization app in React, with...
Registered in England and Wales with Company Number 07625370 | VAT Number 113 1740 61
6-8 Hills Road, Cambridge, CB2 1JP. All material © Cambridge Intelligence .
Privacy Policy | Security Framework
