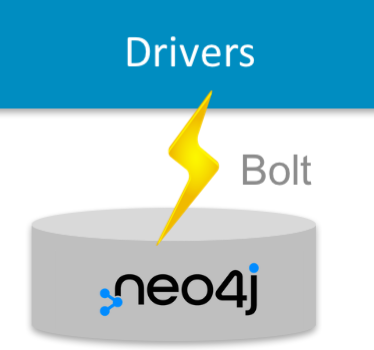
Hooking KeyLines up to the Neo4j Bolt Protocol
Sonali Singh Solutions Engineer
27th April, 2021 | 8 min read
Learn how to use the Neo4j Bolt Protocol to visualize Neo4j graph databases with the KeyLines graph visualization...
Sonali Singh Solutions Engineer
27th April, 2021 | 8 min read
Learn how to use the Neo4j Bolt Protocol to visualize Neo4j graph databases with the KeyLines graph visualization...
Christian Miles VP of Sales
19th January, 2021 | 10 min read
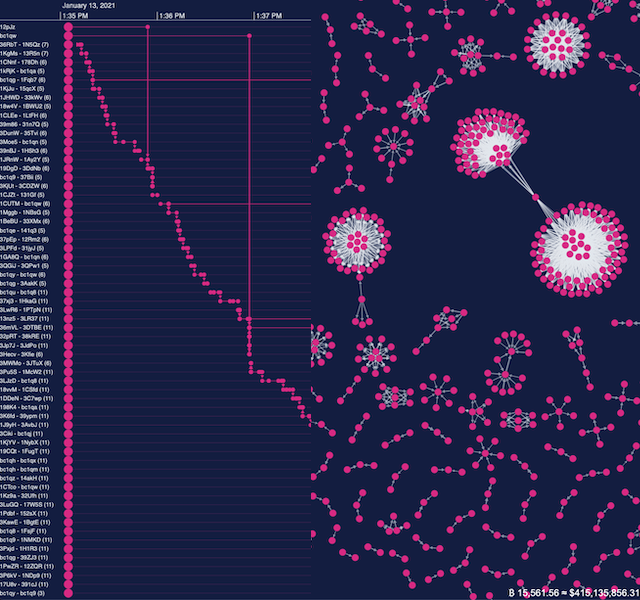
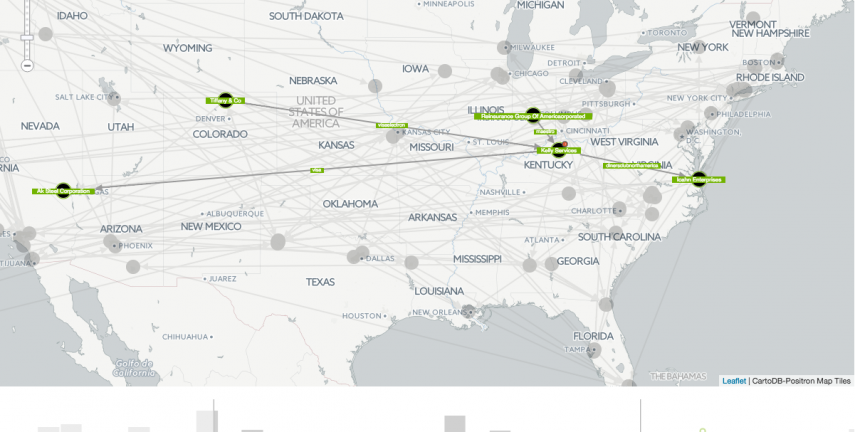
Find out how to use KeyLines and KronoGraph to create your own live, integrated Bitcoin timeline and chart...
Dan Williams Head of Product Management
10th November, 2020 | 9 min read
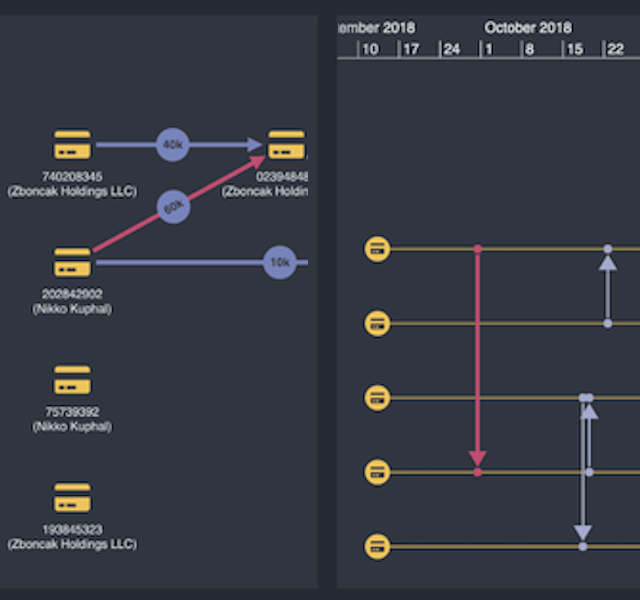
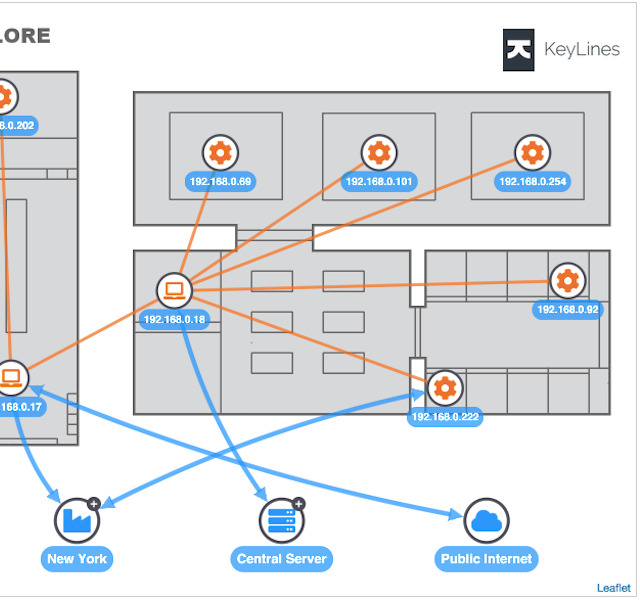
Follow this developer tutorial to build a powerful app for network and time-based data analysis. With detailed...
Christian Miles VP of Sales
17th February, 2020 | 7 min read
This step-by-step developer tutorial describes how to integrate KeyLines with Amazon Neptune using AWS...

Christian Miles VP of Sales
3rd February, 2020 | 10 min read
In this developer tutorial, we’ll use SPARQL to query a DBpedia knowledge graph visualization of connections...
Phil Rodgers Software Developer
11th March, 2019 | 5 min read
This developer tutorial demonstrates how to use images as backdrops. With detailed code examples throughout,...
Catherine Kearns Content Strategist & Team Lead
28th July, 2017 | 6 min read
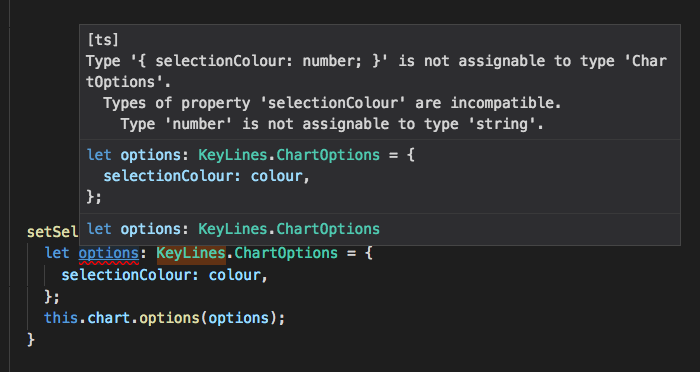
Learn how to use TypeScript to write cleaner, faster, safer JavaScript code for your KeyLines graph visualization...
Miro Marchi Intern - Marketing
18th August, 2016 | 11 min read
This is the last in a series of blog posts written for D3 developers interested in network visualization. Read...
Miro Marchi Intern - Marketing
25th July, 2016 | 10 min read
This is the second in a series of blog posts written for D3 developers interested in network visualization. Read...