Untangling the hairball: Visualizing Donald Trump’s network
Christian Miles VP of Sales
6th February, 2017 | 6 min read
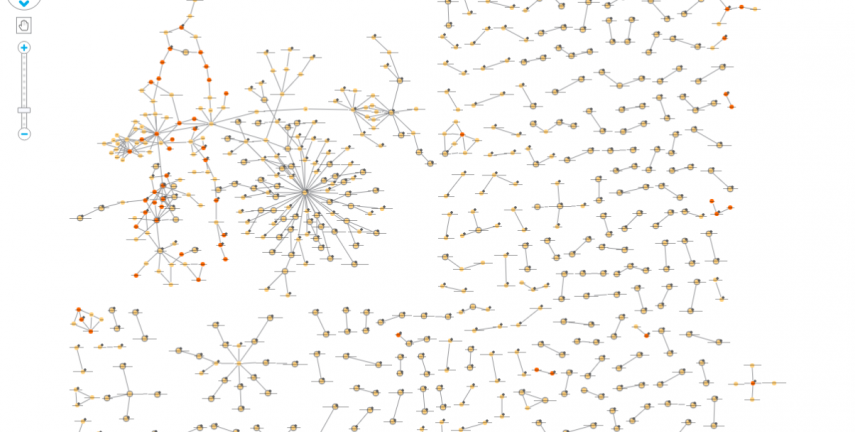
A few weeks ago, four investigative journalists from Buzzfeed released an intriguing new dataset called...
Christian Miles VP of Sales
6th February, 2017 | 6 min read
A few weeks ago, four investigative journalists from Buzzfeed released an intriguing new dataset called...
Andrew Disney Marketing Director
30th January, 2017 | 5 min read
Font icons are web font files made up of symbols and icons. Learn how to use them in your KeyLines graph...
Duncan Grant Sales Engineer
18th January, 2017 | 5 min read
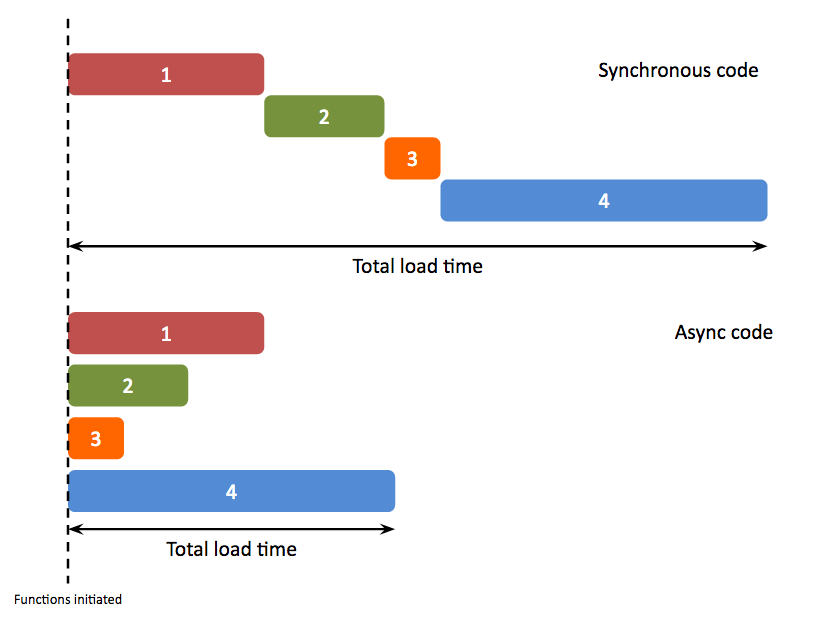
Introducing asynchronous code and basic Promises In KeyLines 3.3, we announced support for JavaScript Promises. We...
Christian Miles VP of Sales
12th January, 2017 | 5 min read
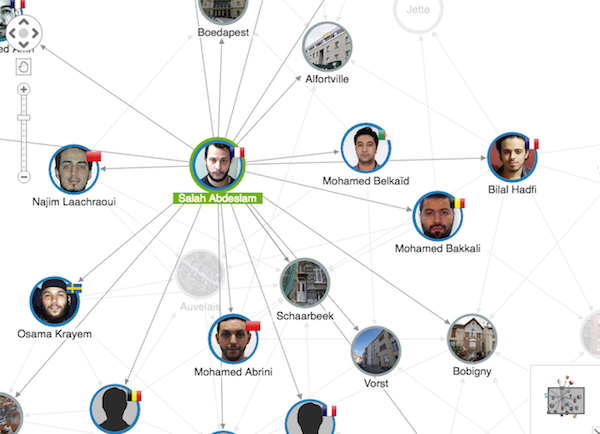
We give tips on getting started with a new graph dataset by visualizing the terrorist network surrounding suspects...

Andrew Disney Marketing Director
10th January, 2017 | 4 min read
Identifying Threat, Risk & Harm KeyLines has been incorporated into a new Microsoft Services platform for UK...

Andrew Disney Marketing Director
3rd January, 2017 | 2 min read
In this FAQ blog post, we’ll take a closer look at the KeyLines Graph Engine to understand what it is and how it...
Andrew Disney Marketing Director
15th November, 2016 | 6 min read
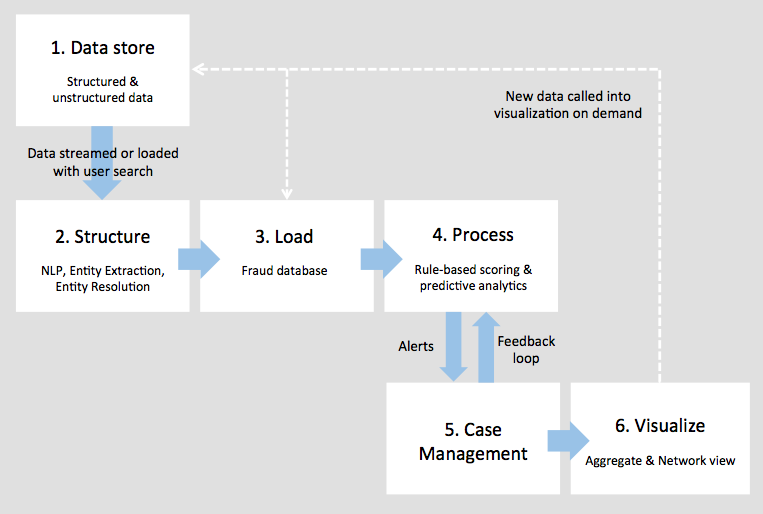
The best fraud detection processes use the right tools at every stage. Find out how important KeyLines and link...
Andrew Disney Marketing Director
4th October, 2016 | 2 min read
In these 9 simple steps, you can integrate KeyLines with Elasticsearch to build your own custom graph...
Andrew Disney Marketing Director
8th September, 2016 | 4 min read
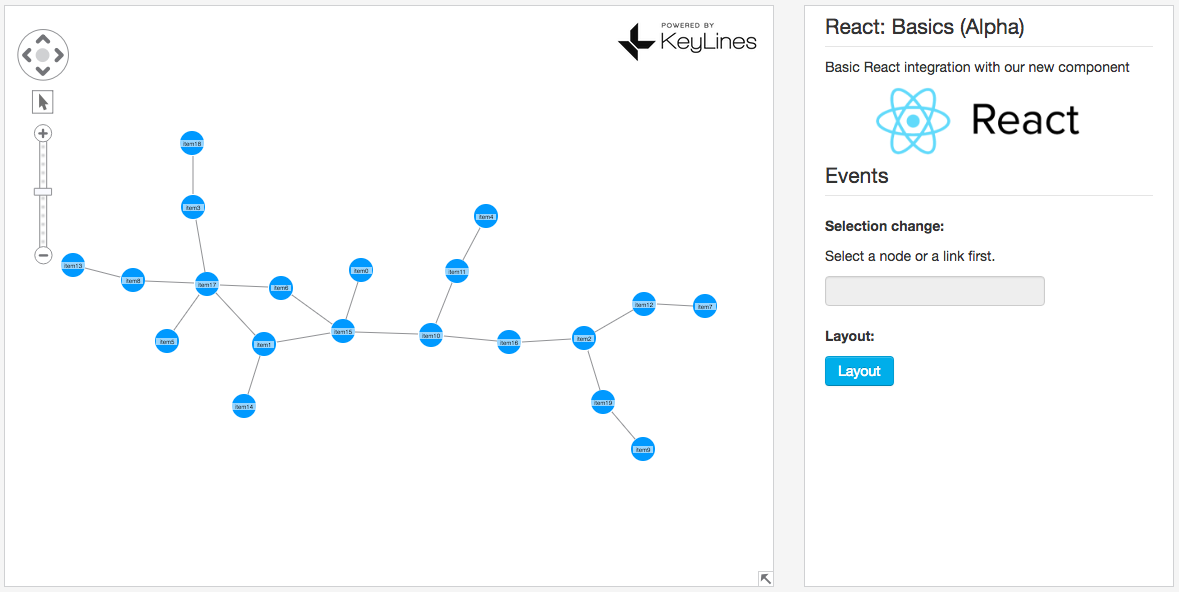
If you can’t use ReGraph, our graph visualization toolkit for React developers, find out how to integrate...