Game of Nodes: Visualizing a 13-14th century social network
Catherine Kearns Content Strategist & Team Lead
14th January, 2019 | 6 min read
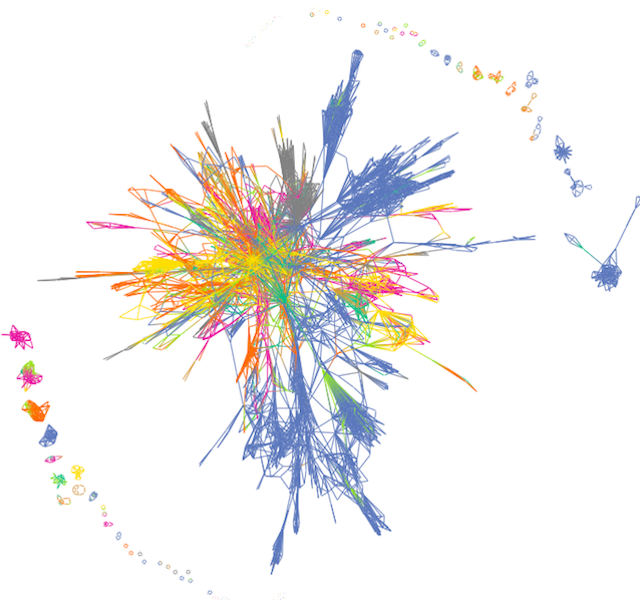
In this blog post, we’ll bring a medieval community to life. Our graph visualizations will help us gain insight...