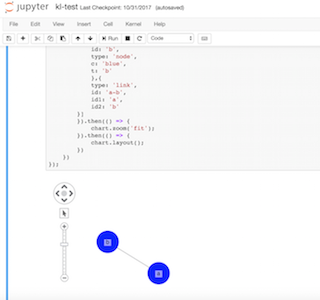
Python graph visualization using Jupyter & KeyLines
Duncan Grant Sales Engineer
8th January, 2018 | 5 min read
Sharing intelligence is a key part of every graph analysis workflow. Once your connected data has been explored,...
Duncan Grant Sales Engineer
8th January, 2018 | 5 min read
Sharing intelligence is a key part of every graph analysis workflow. Once your connected data has been explored,...
Andrew Disney Marketing Director
4th December, 2017 | 5 min read
A quick history lesson Back in February 2015, Aurelius – the organization behind the Titan graph database...
Christian Miles VP of Sales
13th November, 2017 | 6 min read
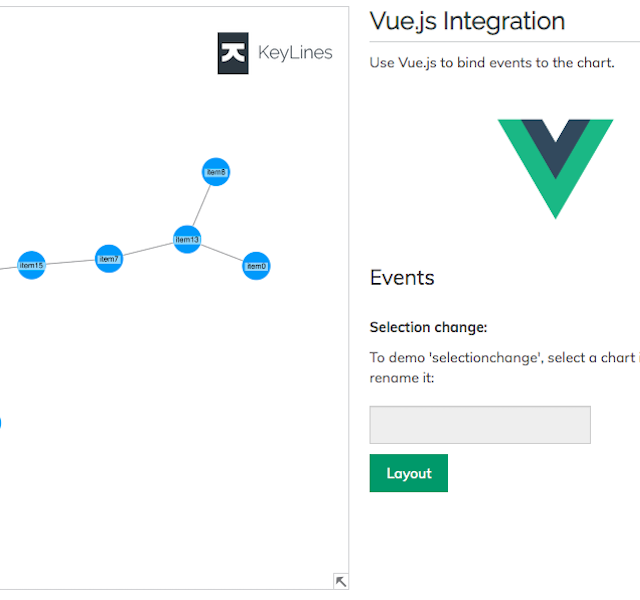
This blog explores the Vue JavaScript framework, and how it can help you build a KeyLines graph visualization...

Christian Miles VP of Sales
29th August, 2017 | 6 min read
Using data from online adverts, we explore a graph visualization-led approach to understanding human trafficking...
Dan Williams Chief Product Officer
13th June, 2017 | 6 min read
Using connected data visualization techniques to manage supply chain risk, ensure restricted substance compliance...
Christian Miles VP of Sales
7th June, 2017 | 6 min read
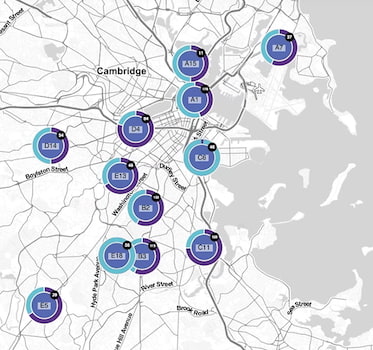
We take a Neo4j graph database of real-life crime incidents in Boston and apply graph visualization techniques to...
Andrew Disney Marketing Director
12th May, 2017 | 5 min read
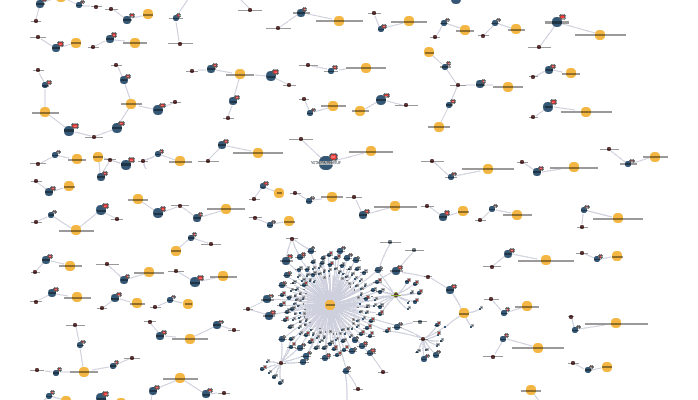
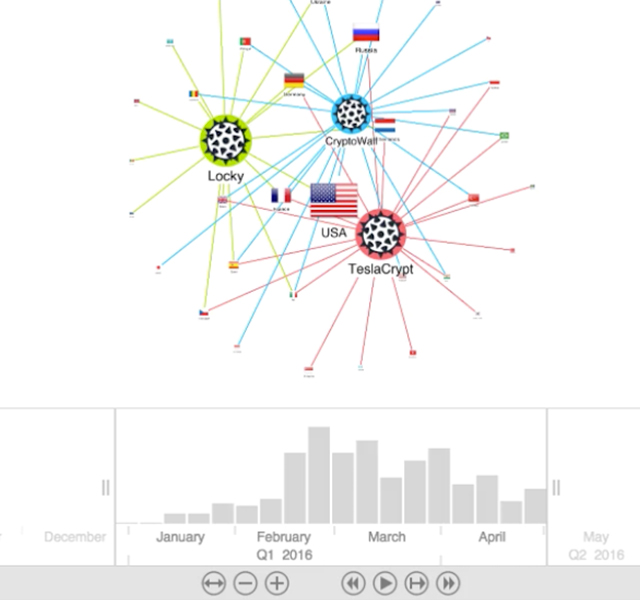
This post explores how KeyLines graph visualization simplifies complex Malware networks, making post-attack...
Dan Williams Chief Product Officer
8th May, 2017 | 4 min read
How to get started with KeyLines and Angular. Build your own advanced graph visualization app using the KeyLines...
Stephen Hughes Development Manager
11th April, 2017 | 3 min read
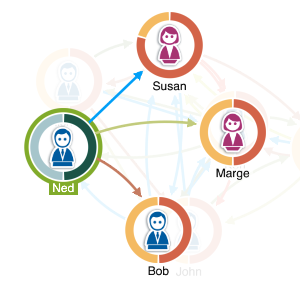
Here are top tips on when to use our donuts feature. They’ll help make your graph visualization apps as...
Registered in England and Wales with Company Number 07625370 | VAT Number 113 1740 61
6-8 Hills Road, Cambridge, CB2 1JP. All material © Cambridge Intelligence .
Privacy Policy | Security Framework
