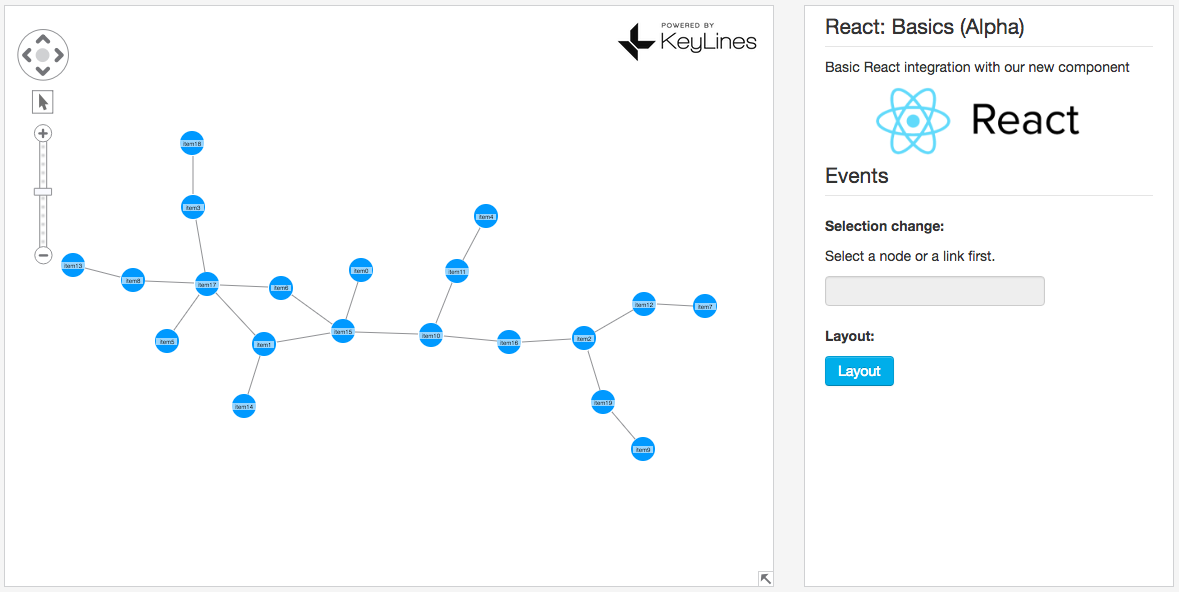
Integrating ReactJS with the KeyLines toolkit
Andrew Disney Marketing Director
8th September, 2016 | 4 min read
If you can’t use ReGraph, our graph visualization toolkit for React developers, find out how to integrate...
Andrew Disney Marketing Director
8th September, 2016 | 4 min read
If you can’t use ReGraph, our graph visualization toolkit for React developers, find out how to integrate...
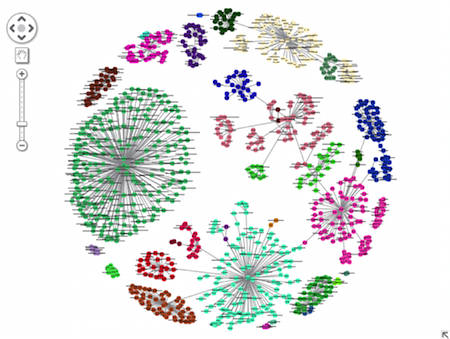
Andrew Disney Marketing Director
12th April, 2016 | 4 min read
We recently announced the release of KeyLines 3.0 – the third major edition of our network visualization...
Andrew Disney Marketing Director
6th April, 2016 | 4 min read
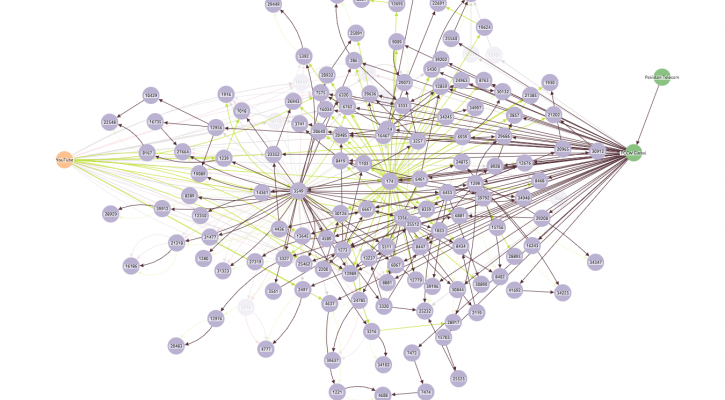
There are lots of ways for a cyber security analyst to look at their data – as tables, bar charts, line...

Andrew Disney Marketing Director
13th January, 2016 | 4 min read
Learn how EclecticIQ launched a pioneering cyber threat intelligence platform that includes graph visualization...
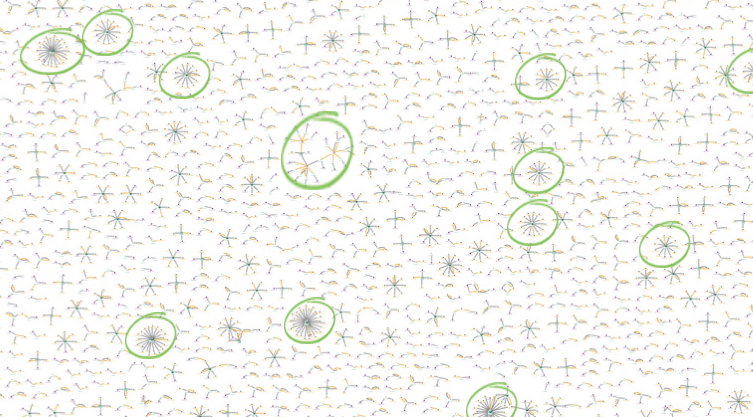
Andrew Disney Marketing Director
11th January, 2016 | 3 min read
Our clustering function can identify communities in your networks. It has been carefully optimized to balance...
Andrew Disney Marketing Director
29th October, 2015 | 4 min read
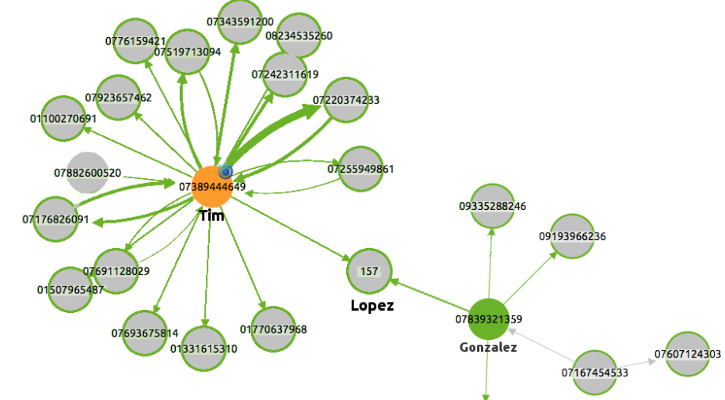
Modern Customer Relationship Management (CRM) is about more than simply tracking behavior and enlisting customers...
Valerio Cestarelli Intern - Software Development
6th October, 2015 | 4 min read
Maintaining the integrity of cyberinfrastructure and understanding network vulnerabilities is a critical task for...
Andrew Disney Marketing Director
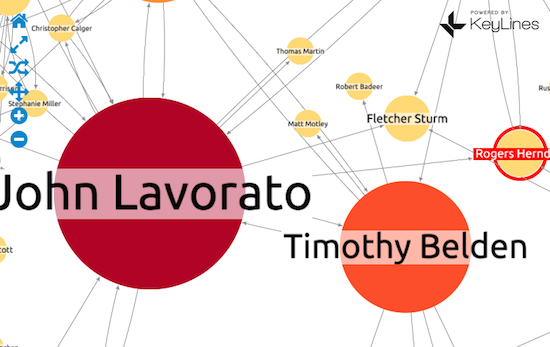
21st July, 2015 | 6 min read
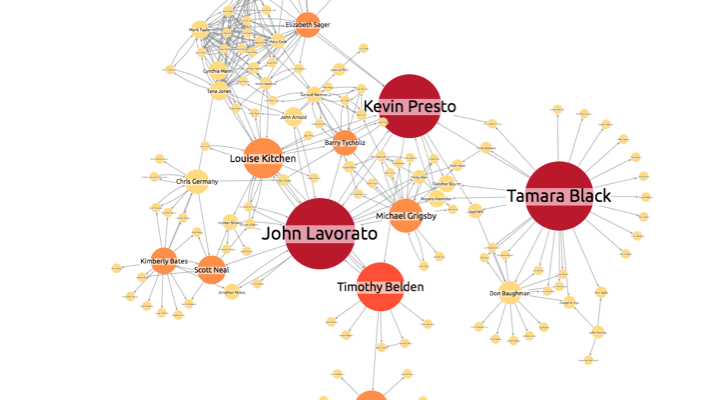
Using network visualization and SNA measures, our intern plays detective and dissects the connections in the Enron...
Andrew Disney Marketing Director
2nd July, 2015 | 2 min read
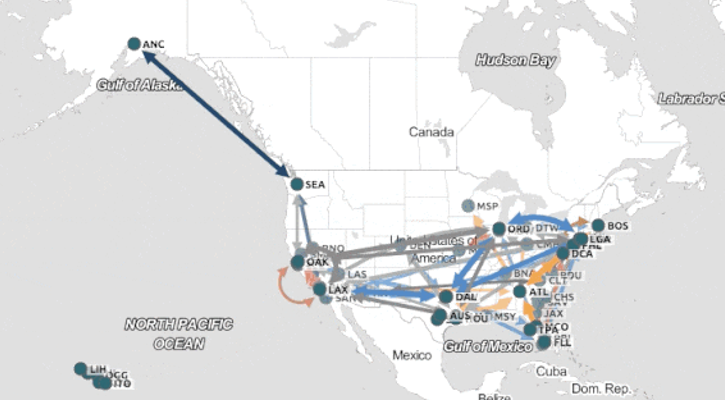
This post was published some time ago. It’s still useful, but it’s worth checking out MapWeave, our...
Registered in England and Wales with Company Number 07625370 | VAT Number 113 1740 61
6-8 Hills Road, Cambridge, CB2 1JP. All material © Cambridge Intelligence .
Privacy Policy | Security Framework
