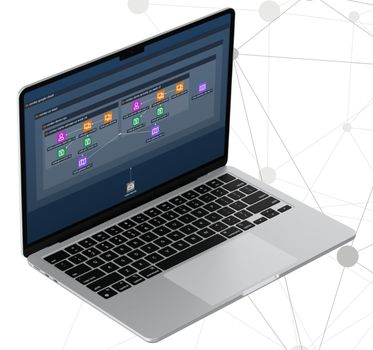
Data visualization with ChatGPT: A developer tutorial
Ryan Shimmon Commercial Software Developer
12th August, 2025 | 10 min read
This tutorial shows how to integrate data visualization with ChatGPT, OpenAI’s large language model (LLM)...
Ryan Shimmon Commercial Software Developer
12th August, 2025 | 10 min read
This tutorial shows how to integrate data visualization with ChatGPT, OpenAI’s large language model (LLM)...
Ryan Shimmon Commercial Software Developer
28th July, 2025 | 10 min read
In this technical post, Matt from our development team shares one of the ways he uses React Hooks to produce...
Rosy Hunt Content Marketing Specialist
10th July, 2025 | 4 min read
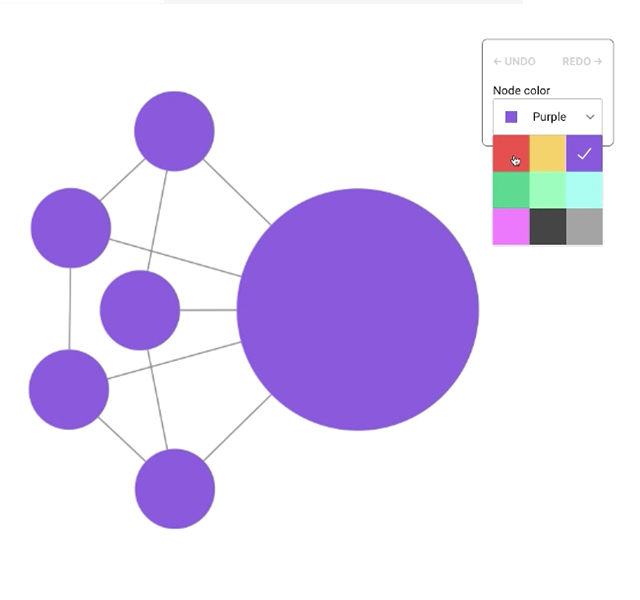
The newest versions of our data visualization tools bring features that make them faster, better-looking, and...
Zach Mason Product Designer
24th June, 2025 | 18 min read
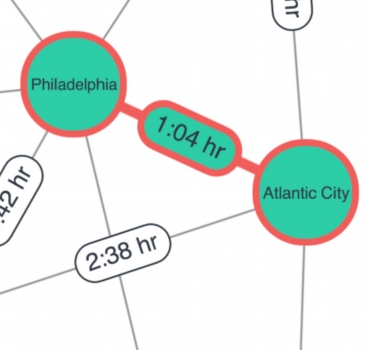
We share expert graph visualization UX principles that make the difference between user frustration and...
Rosy Hunt Content Marketing Specialist
20th May, 2025 | 2 min read
We’ve developed an integration with Google Cloud’s Spanner Graph that showcases how our combined technologies...
Courtney Collins Product Manager
13th May, 2025 | 3 min read
From sleeker animations to richer styling and smoother interactions, these updates help you create visualizations...
Dan Williams Chief Product Officer
8th May, 2025 | 3 min read
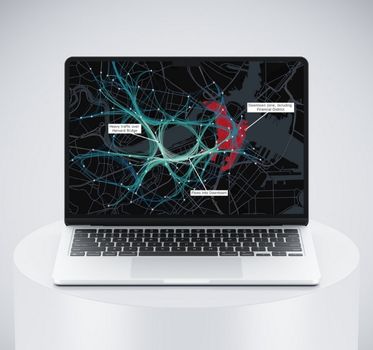
MapWeave, our new geospatial data visualization SDK for building map-based investigation and intelligence tools,...
Ryan Hamilton Client-facing Developer
31st March, 2025 | 11 min read
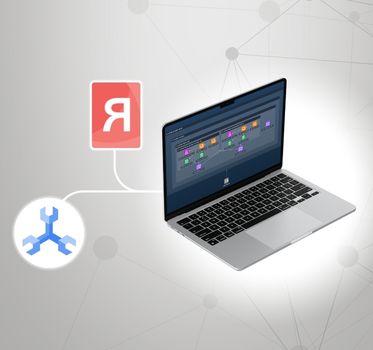
We walk you through how to build a cloud security application that leverages an integration between Google...
Clare Haynes Product Designer
4th February, 2025 | 3 min read
Good user experience (UX) design is the foundation of a successful data visualization experience. It lets users...
Registered in England and Wales with Company Number 07625370 | VAT Number 113 1740 61
6-8 Hills Road, Cambridge, CB2 1JP. All material © Cambridge Intelligence .
Privacy Policy | Security Framework
