
React Material UI data visualization tutorial
Thomas Chan Software Developer
12th January, 2021 | 6 min read
Follow this React Material UI tutorial to get Material Design icons working with ReGraph and build stylish graph...
Thomas Chan Software Developer
12th January, 2021 | 6 min read
Follow this React Material UI tutorial to get Material Design icons working with ReGraph and build stylish graph...
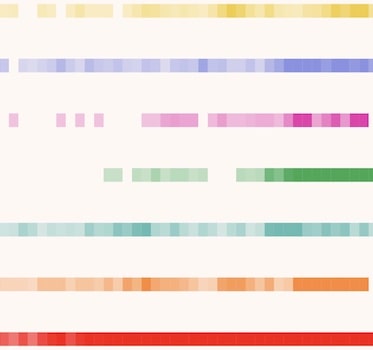
Andrew Disney Marketing Director
24th November, 2020 | 10 min read
We explore basic color theory, and how carefully-chosen colors can help make your visualizations look good, and...
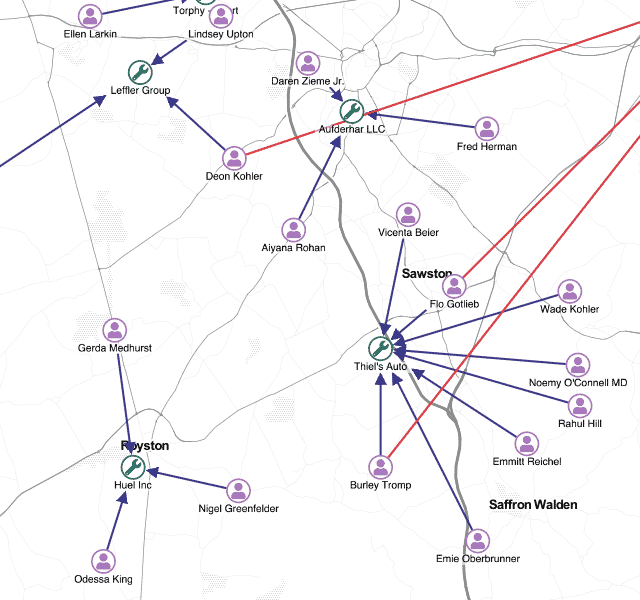
Kevin Naughten Senior Product Manager
15th July, 2019 | 6 min read
Let’s create visual models that deliver the best user experience (UX). Detailed graph visualizations from an...
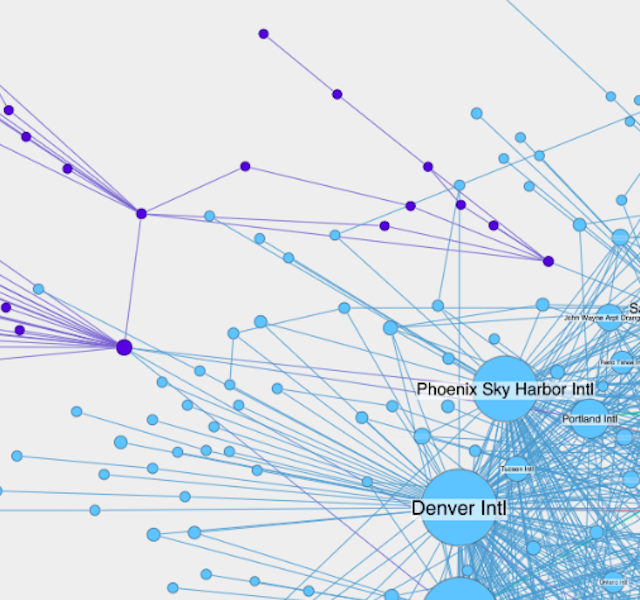
Dan Williams Chief Product Officer
17th June, 2019 | 5 min read
How to build great graph visualization tools that fit seamlessly inside your existing applications, matching...
Registered in England and Wales with Company Number 07625370 | VAT Number 113 1740 61
6-8 Hills Road, Cambridge, CB2 1JP. All material © Cambridge Intelligence .
Privacy Policy | Security Framework
