FREE: Start your trial today
Visualize your data! Request full access to our SDKs, demos and live-coding playgrounds.
Every analyst and investigator relies on tried and tested methods to solve crimes, uncover threats and identify bad actors. In this post, we explore popular link analysis techniques that form an essential part of their workflows.
The link analysis techniques we’ll cover are established methods used by analysts and investigators every day:
You’ll see examples of how timeline visualization complements link analysis techniques in each use case. Each image and animation demonstrates what you can achieve with our data visualization toolkits.
The data in complex investigations takes many forms, such as:
These data types have a key feature in common: they contain connections between people, places and events over time. They’re almost always huge, busy datasets, so if you want to analyze those connections, you need to visualize them.
Link analysis, sometimes called graph visualization, is the term for presenting data as a visual network of nodes connected by links. This technique offers the fastest, most reliable way to understand complex connections and identify hidden patterns and anomalies.
In the digital age, the “follow the money” method has become even more effective, thanks to advancements in technology and data analysis.
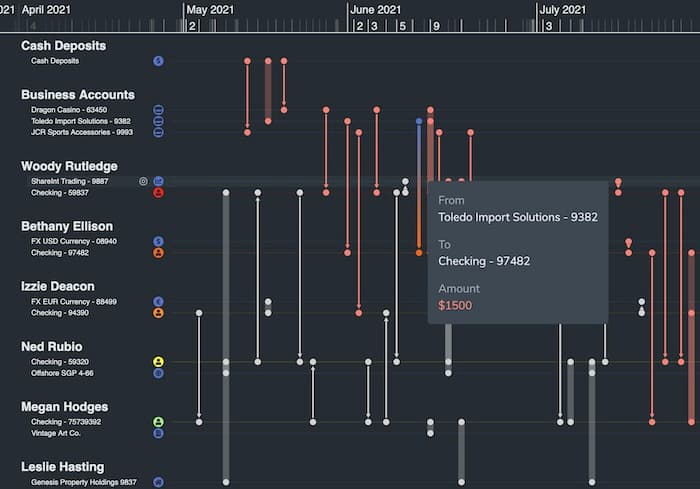
Definition: Once suspicious funds disguised as legitimate financial assets are detected, AML investigators use this technique to track, report and prevent their movement.
Money laundering is not a victimless crime. Organized crime groups often use their illicit funds for the most serious offenses, including human trafficking, drug dealing and funding terrorism.
Non-compliance with AML regulations leads to fines and even criminal charges. Banks, service providers and financial institutions must carry out extensive customer due diligence and “know your customer” processes to comply with AML regulations. That includes monitoring customer transactions and reporting any known signs of fraud.
It’s interactive: Link analysis is an intuitive way to investigate complex, multi-layered networks. It enables analysts to find hidden relationships, patterns, dependencies and anomalies that might indicate criminal activity.
It exposes hierarchies: Visualizing transactions paints a clear picture of control structures and rankings between businesses, shareholder groups or account holders.
It reveals important trends: Advanced rules-based link analysis algorithms are a key part of the “follow the money” process. They help investigators to recognize common patterns of behavior, and make fast decisions about where to focus their attention.
How link analysis for AML powers successful compliance
In a forensic context, pattern of life analysis is coming more front and center as investigators realize how much data is available […] to plot a virtually minute-by-minute description of how a person spent a given day or even week.
Definition: This technique investigates the habits or behaviors of persons of interest over time, based on large quantities of observed data.
Surveillance teams use it to understand regular schedules, such as how a bad actor spends a typical day, week or month.
Once they get the full picture of a bad actor’s activities, it’s easier to spot irregular behaviors, such as a visit to a new location, or an unusually-long time spent communicating with an unfamiliar associate online.
It helps investigators to make predictions and take pre-emptive operational actions. For example, a surveillance team might send a drug dealer’s regular flight number to border control, in advance of an anticipated journey.
It lets you see a huge volume of pattern of life data all at once. A timeline visualization heatmap gives a high-level view of an entire dataset, revealing its overall shape and helping to identify areas for further analysis.
It exposes hierarchies: Visualizing transactions paints a clear picture of control structures and rankings between businesses, shareholder groups or account holders.
It reveals key insights in behavior patterns. Zooming into the data visualization immediately uncovers sequences and anomalies that might indicate suspicious behavior.
It’s the fastest way to identify unusual activity. Without interactive visual analytics tools, investigating behaviors would be a lengthy, difficult task. Spotting outliers is much easier when you can see them color-coded against a background of regular activities.
Pattern of life analysis with KronoGraph timelines
When an incident occurs, steps must be taken to understand its root causes and ensure appropriate remediating action is taken. The aim should be to […] identify systemic problems, rather than to fix a very narrow issue.
Definition: This method investigates and identifies the primary event(s) that triggered an incident, such as a data breach or intrusion attempt.
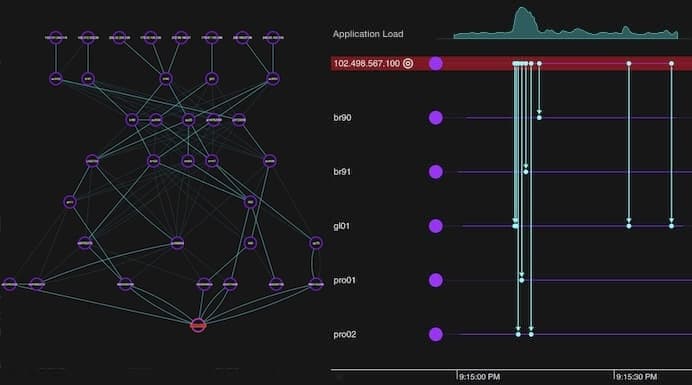
Observability: Root cause analysis is part of an overall observability solution, where DevOps engineers and software architects need to understand the full topology of their network and its connected components.
Investigation: When a cyber attack happens, incident response teams need to understand how, where and when the attack originated.
Mitigation: Investigators need to isolate the incident as early as possible, to minimize damage.
Prevention: Insights gained from investigating and reviewing the incident help to shape future cybersecurity strategy, and keep networks safer.
It helps investigators spot unusual connections that would be hard to identify in a log file, such as multiple nodes linked to a suspicious IP address.
It uncovers activity hidden in billions of data points. When searching for the root cause of a cyber incident, investigators can use timeline visualization to reveal details of every individual cyber event with nanosecond precision.
This link analysis technique reveals the sequence of events immediately before and after an incident, so it’s easy to track back and spot anomalies in the data flow.
Investigators need a way to provide create clear, concise incident reporting. Sharing link analysis visualizations gives senior information officers and other stakeholders easy access to details they can understand immediately.
Root cause analysis with timeline & graph visualization
CDR analysis can be invaluable in establishing relationships between defendants or determining wider locations such as the town or city a call was made or received.
Definition: CDR analysis is a technique for understanding telecommunication and voice over IP (VoIP) records, including how, when and where a call was made, who participated, and other important diagnostic information.
It validates criminal connections. Law enforcement agencies must find and validate links between suspects, events and crimes. Increasingly, that relies on retrieval and understanding of call data records.
It links people to crime locations. Combined with cell site analysis, CDR can place a bad actor’s cellphone at the scene of a crime, providing a vital geospatial element.
It’s essential to infrastructure management. Telecoms infrastructure managers rely on CDR analysis to understand customer behaviors, maintain a reliable telecoms network, and plan strategic improvements.
It transforms complex data into shareable, actionable intelligence Call data records come in many raw formats – such as network logs, or lists of cell towers and cell phone account holders. Link analysis brings them all together in one easy-to-navigate visualization.
It’s the most intuitive way to filter and explore huge datasets, revealing the most active callers in a network at a glance. Customization, such as applying colors to differentiate subgroups, makes identifying connections even easier.
Patterns and anomalies in caller behavior are revealed when you map out the entire telecommunications network. Investigators can dig deeper into the data to examine individual connections.
Investigators can easily export their findings to share progress with collaborators, create reports for stakeholders, or provide admissible court evidence.
Webinar: COMINT analysis in 5 steps
What sets a good network structure apart from a bad network structure is its ability to fight data breaches. Every organization — from banks and corporate buildings to power factories and supply chains — must structure its networks to be less vulnerable to security threats.
Definition: This technique creates a node-link version of an IT network’s architecture that maps out the connections between physical and virtual assets.
It gives complete visibility of your network. Complex cloud infrastructure carries a significant risk of accidental misconfiguration. That can expose organizations to threat, or result in breaches of data protection law.
It helps you locate, isolate and recover from a data breach or intrusion, minimizing outages. Delays caused by network disruption leave you vulnerable to further attacks – and they can be expensive, both financially and reputationally.
It puts you in control of your network. Organizations need to proactively mitigate against risk, but it’s impossible to put together a disaster recovery plan or contingency report without knowing your network topology.
Infrastructure resilience relies on understanding connections. Link analysis tools offer an automated, interactive, visual approach that works seamlessly with other network monitoring tools.
Applying link analysis to network topology reveals vulnerabilities and potential threats. It’s easier to find weaknesses or bottlenecks, or dangerous over-reliance on specific nodes.
It prevents alert fatigue without sacrificing insight. Many businesses use extended detection and response (XDR) to aggregate the threat data behind the constant breach warnings from their cybersecurity dashboards. But without an interactive link analysis tool, this doesn’t provide true insight. They need a scalable, intuitive way to investigate threat data.
OpsCruise: Clearer Kubernetes observability data
With the support of robust technology, SNA becomes reliable across time, data, analysts, and networks and quickly produces actionable results inside any operational law enforcement environment.
Definition: SNA uses graph theory to understand and measure social networks. It reveals how they’re organized, how they behave, and how the nodes inside them interact.
SNA helps to predict criminal activity and monitor connections. Investigators working in law enforcement or anti-terrorism use it to understand gang dynamics and the structures of organized crime groups.
It provides actionable intelligence. This analysis technique reveals the most influential nodes in a network – from decision makers to communication gatekeepers. If investigators plan to disrupt a network, it helps them visualize scenarios, showing the likely impacts if specific nodes are removed.
SNA explains social behavior by analyzing connections, rather than individuals. It’s an ideal candidate for link analysis, where connections and relationships between nodes are as important as the nodes themselves.
It answers an investigator’s most important questions. A range of centrality measures reveals insights into the power, influence, control and status of every node in a network. Who is the most influential person? Who has access to the most resources? Who can most easily provide information on other nodes in the network?
It prevents alert fatigue without sacrificing insight. Many businesses use extended detection and response (XDR) to aggregate the threat data behind the constant breach warnings from their cybersecurity dashboards. But without an interactive link analysis tool, this doesn’t provide true insight. They need a scalable, intuitive way to investigate threat data.
Social network analysis 101: centrality measures explained
If you’re keen to enhance your investigative techniques with link analysis and timeline visualization, we can help. Get in touch to talk through your workflows and see what our toolkit technology can do, or sign up for a free trial.

Visualize your data! Request full access to our SDKs, demos and live-coding playgrounds.
Registered in England and Wales with Company Number 07625370 | VAT Number 113 1740 61
6-8 Hills Road, Cambridge, CB2 1JP. All material © Cambridge Intelligence .
Privacy Policy | Security Framework


