Link analysis for fraud detection
Andrew Disney Marketing Director
30th January, 2020 | 5 min read
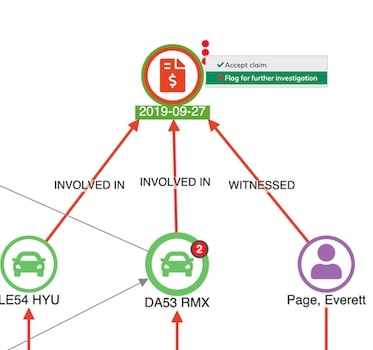
Discover how to use link analysis techniques for fraud detection in this step-by-step example showing typical...
PageRank centrality & EigenCentrality
Andrew Disney Marketing Director
14th January, 2020 | 5 min read
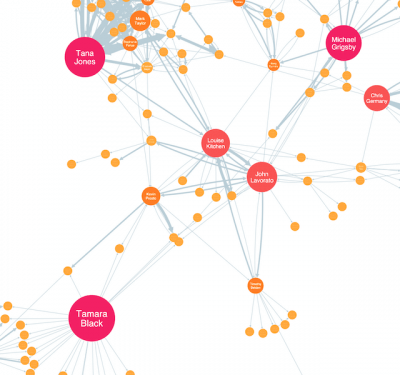
PageRank centrality & EigenCentrality are powerful graph functions in our visualization technology. Discover...
The ultimate guide to creating graph data models
Andrew Disney Marketing Director
7th January, 2020 | 8 min read
Are you trying to create effective data models for graph visualizations? Do your users find insight in connected...
Social network analysis 101: centrality measures explained
Andrew Disney Marketing Director
2nd January, 2020 | 5 min read
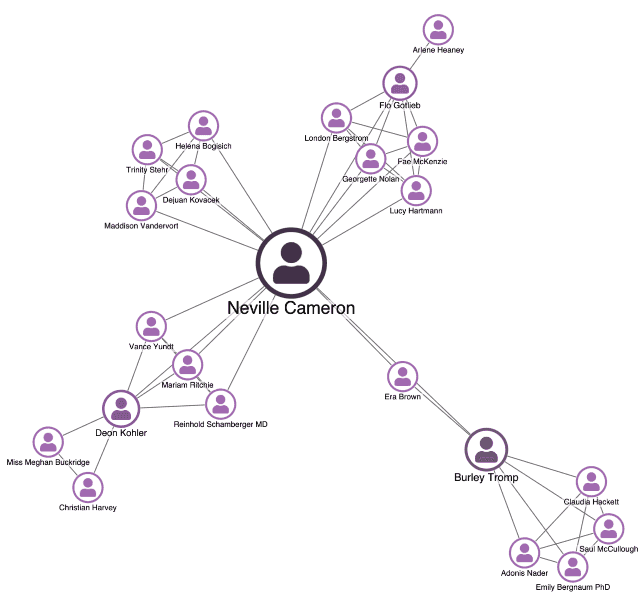
Here’s everything you need to get started with centrality measures: what they are, what they tell us and...
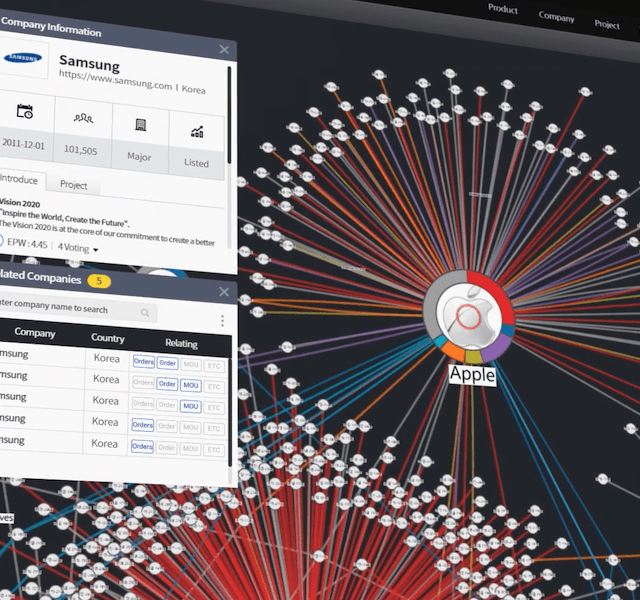
Connected supply chains: the Illunex platform
Andrew Disney Marketing Director
30th September, 2019 | 4 min read
This case study looks at how South Korean startup, Illunex, combines AI with KeyLines’ graph visualization...
How WebGL powers the best user experience
Andrew Disney Marketing Director
20th May, 2019 | 5 min read
Let’s focus on WebGL – what it is, how it works, and why performance is a key contributor to one of...
Visualizing the friendship paradox
Andrew Disney Marketing Director
13th November, 2018 | 6 min read
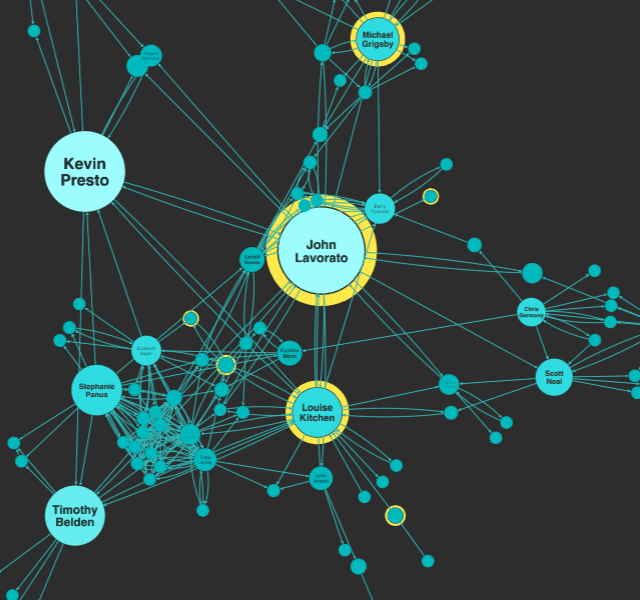
We use the advanced features of our graph visualization technology to test the friendship paradox. We’ll show...
The benefits of a graph visualization application
Andrew Disney Marketing Director
18th May, 2018 | 4 min read
Discover the benefits of graph visualization and why it should be a core part of your web application – it’s...
trust-hub: using graphs to power personal data compliance
Andrew Disney Marketing Director
9th April, 2018 | 5 min read
Discover how trust-hub’s Privacy Lens app and KeyLines-powered graph visualizations help organizations map,...
