The road to net zero – our 2023 update
Kevin Naughten Senior Product Manager
28th June, 2024 | 6 min read
Back in 2021, we made some big climate commitments. Key among them was to be ‘net zero’ by 2030. We think...
3 new & easy ways to simplify complex data visualizations
Kevin Naughten Senior Product Manager
19th December, 2023 | 7 min read
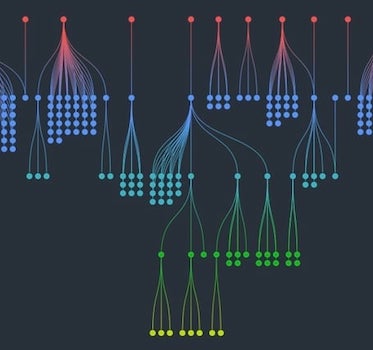
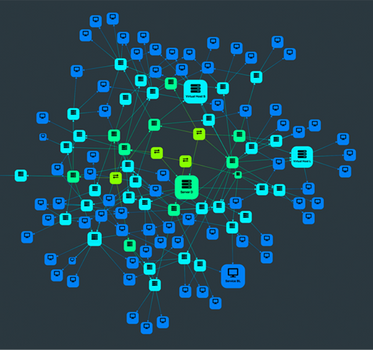
Data overload is a real problem for busy analysts. How do they spot the red flags in a cyber security network? Or...
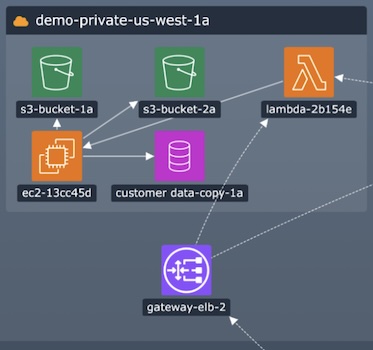
Product update: 3 ways to style & declutter graph visualizations
Kevin Naughten Senior Product Manager
12th December, 2023 | 3 min read
With every version of our KeyLines and ReGraph graph visualization toolkits, we aim to share new features that...
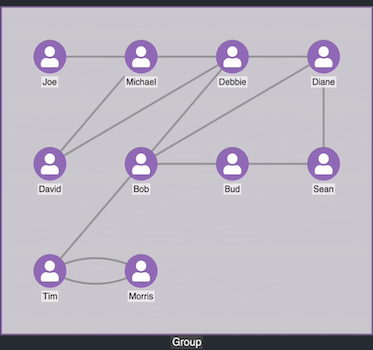
Product update: keep it tight with combos
Kevin Naughten Senior Product Manager
18th July, 2023 | 2 min read
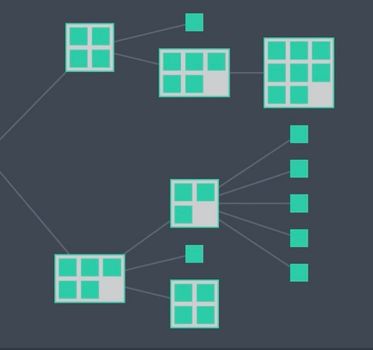
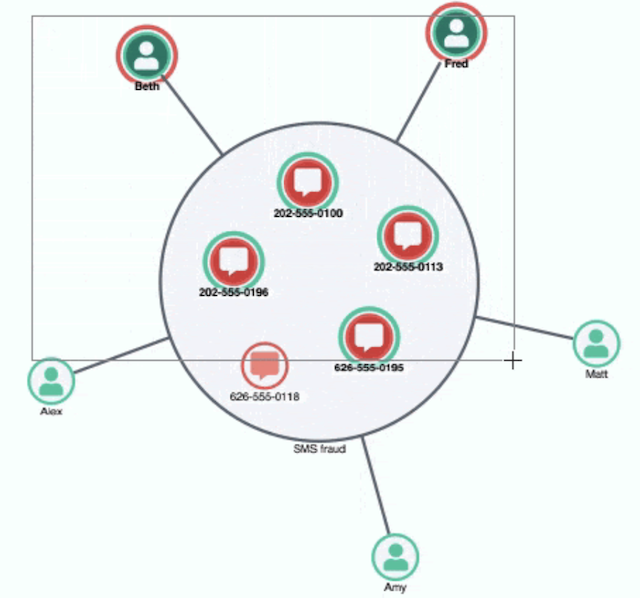
KeyLines 7.2 and ReGraph 4.2, the latest versions of our graph visualization toolkits, are available now. The big...
Product update: 5x faster layout performance
Kevin Naughten Senior Product Manager
30th May, 2023 | 3 min read
KeyLines 7.1 & ReGraph 4.1 feature big performance gains and greater flexibility for our popular sequential...
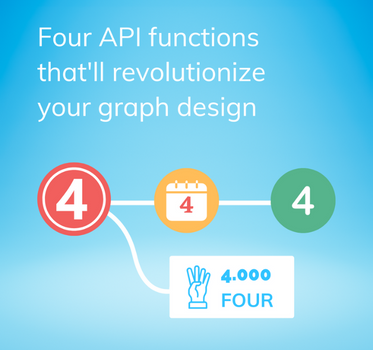
Simple code that’ll revolutionize your graph design
Kevin Naughten Senior Product Manager
14th March, 2023 | 7 min read
We demonstrate some of the game-changing customization features available in the latest updates to our graph...
4 steps to infinitely flexible graph visualization design
Kevin Naughten Senior Product Manager
2nd December, 2022 | 10 min read
Bring the perfect graph visualization design to life: our KeyLines and ReGraph SDKs offer almost infinite...
Product updates: More flexibility with demos and combos
Kevin Naughten Senior Product Manager
27th September, 2022 | 2 min read
The latest releases of our graph visualization SDKs bring more control over combos, and a live coding environment...
Interactive graph visualization: 4 easy styling options
Kevin Naughten Senior Product Manager
15th June, 2021 | 8 min read
Interactive graph visualization just got easier! These 4 examples show how to customize hover and select behavior...


