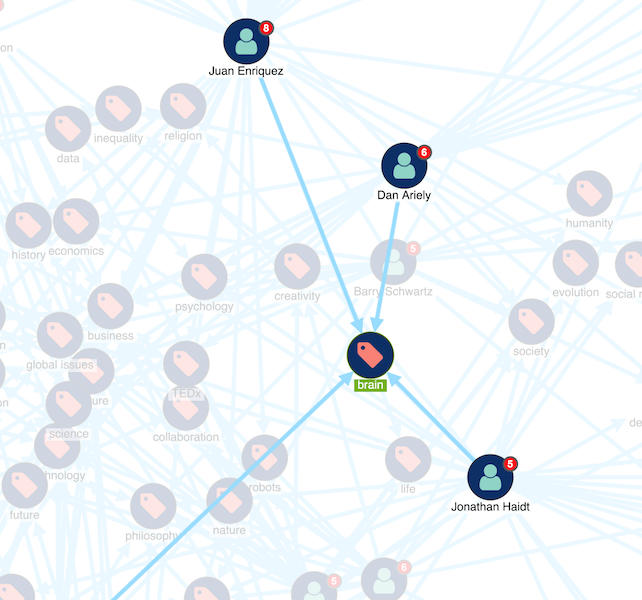
MemGraph visualization tutorial: visualizing TED Talks data
Duncan Grant Sales Engineer
26th November, 2018 | 7 min read
Learn how to integrate the KeyLines graph visualization toolkit with Memgraph. We’ll visualize TED Talks for...
Duncan Grant Sales Engineer
26th November, 2018 | 7 min read
Learn how to integrate the KeyLines graph visualization toolkit with Memgraph. We’ll visualize TED Talks for...
Dan Williams Chief Product Officer
20th November, 2018 | 2 min read
Cambridge Intelligence, creators of connected data visualization tools that make the world safer, today announced...
Dan Williams Chief Product Officer
20th November, 2018 | 2 min read
We’re excited to announce the release of KeyLines 5.0: the next generation in visualizing connections in...
Andrew Disney Marketing Director
13th November, 2018 | 6 min read
We use the advanced features of our graph visualization technology to test the friendship paradox. We’ll show...
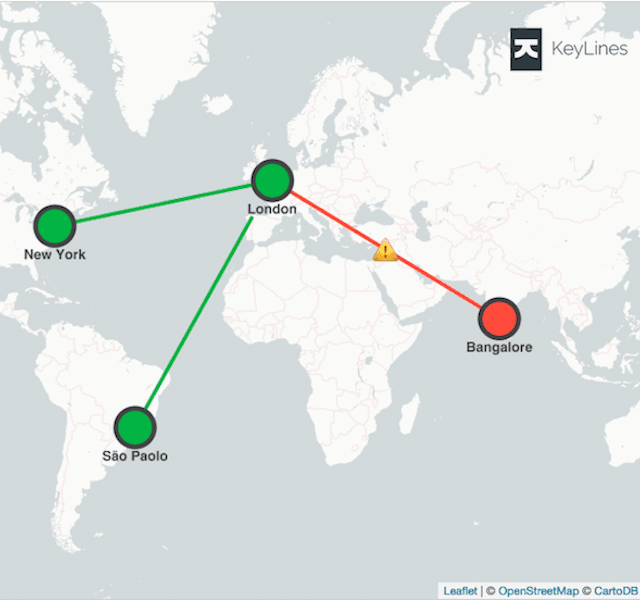
Dan Williams Chief Product Officer
17th October, 2018 | 7 min read
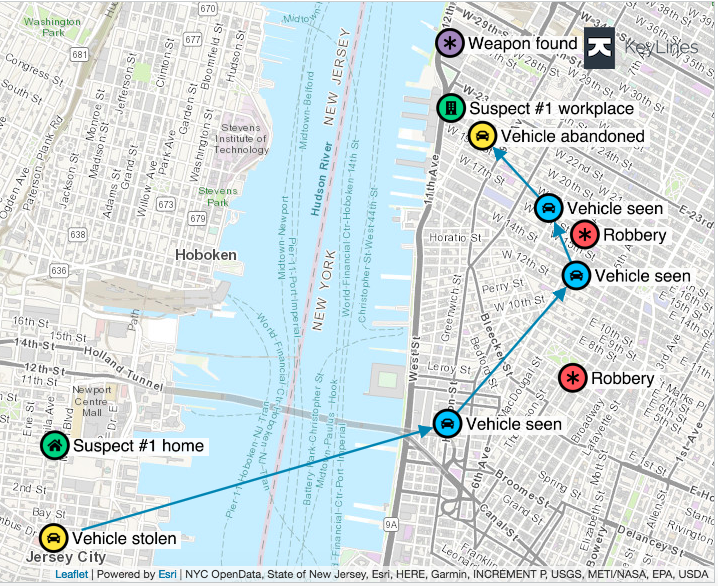
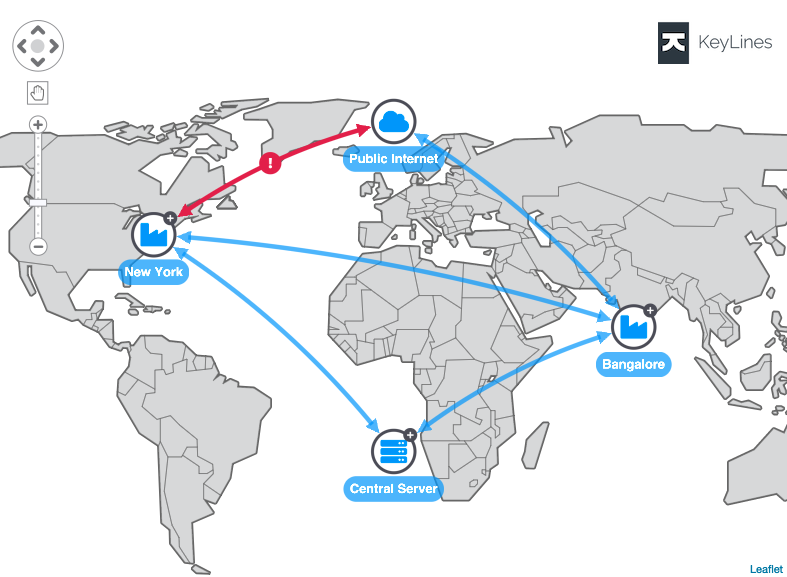
With KeyLines and Neo4j graph database integrations, exploiting geospatial data has never been easier. Discover...
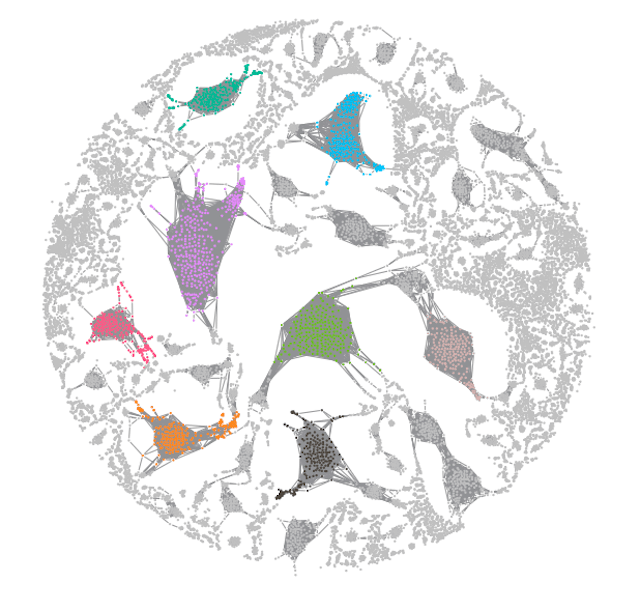
Dan Williams Chief Product Officer
21st September, 2018 | 8 min read
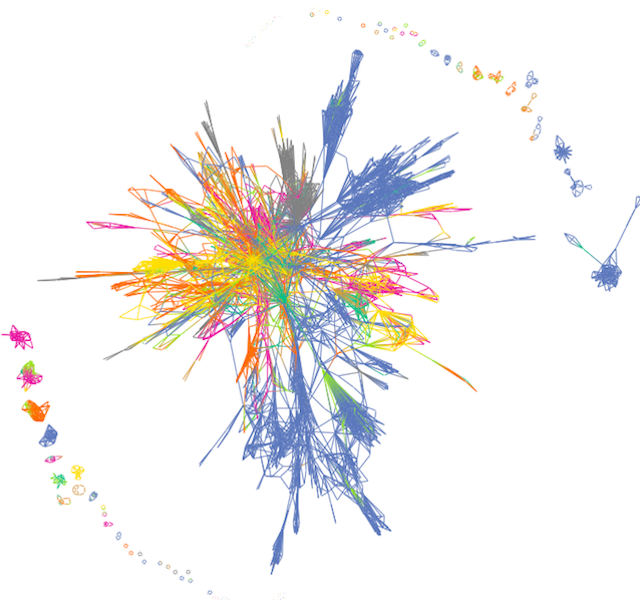
A step-by-step guide to understanding and visualizing very large graph datasets using our ReGraph & KeyLines...

Oscar Chen Intern - Software Development
12th September, 2018 | 5 min read
Every year we welcome a group of students and recent graduates to our three-month summer internship at Cambridge...

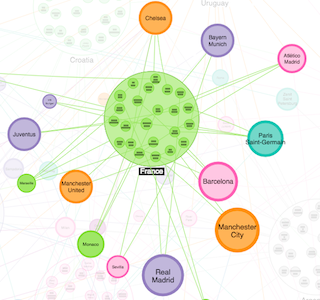
Dan Williams Chief Product Officer
18th July, 2018 | 5 min read
We take a closer look at how we used graph theory to predict France as the 2018 FIFA World Cup winners....
Dan Williams Chief Product Officer
29th June, 2018 | 4 min read
We hear a lot of success stories about how graph theory can make stunning predictions. In this blog post we test...
Registered in England and Wales with Company Number 07625370 | VAT Number 113 1740 61
6-8 Hills Road, Cambridge, CB2 1JP. All material © Cambridge Intelligence .
Privacy Policy | Security Framework
