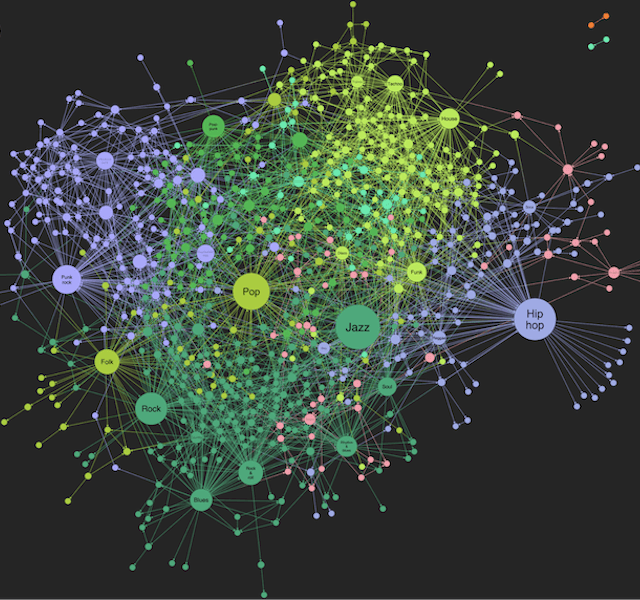
How to visualize a DBpedia knowledge graph
Christian Miles VP of Sales
3rd February, 2020 | 10 min read
In this developer tutorial, we’ll use SPARQL to query a DBpedia knowledge graph visualization of connections...
React Neo4j visualization using GRANDstack
Christian Miles VP of Sales
21st October, 2019 | 9 min read
We show how quickly and easily you can use GRANDstack and ReGraph to create powerful React Neo4j visualization...
Getting started with ReGraph, our React toolkit
Christian Miles VP of Sales
3rd June, 2019 | 7 min read
This step-by-step tutorial covers everything you need to get started with ReGraph, the graph visualization toolkit...
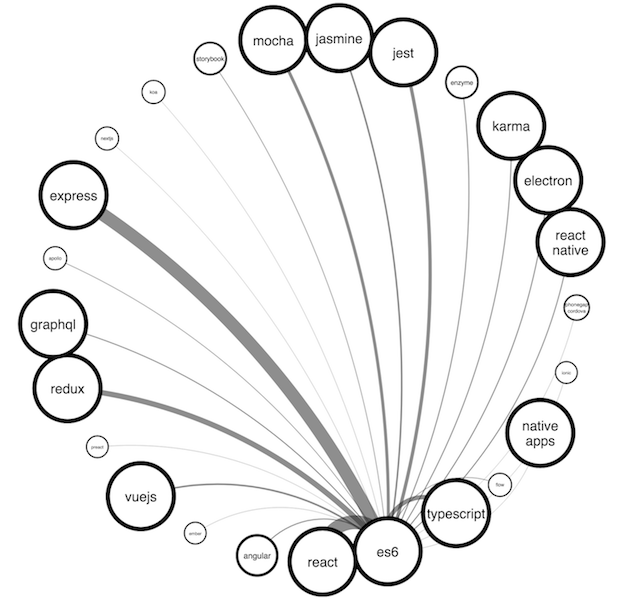
Bring chord diagrams to life with graph visualization
Christian Miles VP of Sales
18th March, 2019 | 7 min read
There are so many visualization options to choose from. In this post, we examine the pros and cons of one popular...
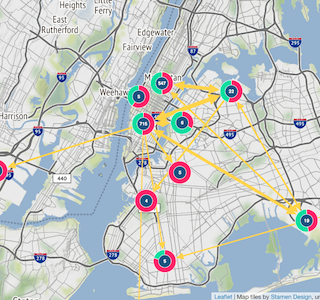
Creating an NYC taxi data visualization with KeyLines
Christian Miles VP of Sales
18th June, 2018 | 5 min read
In this blog, we use a New York taxi cab database to show how graph visualization can be useful when working with...
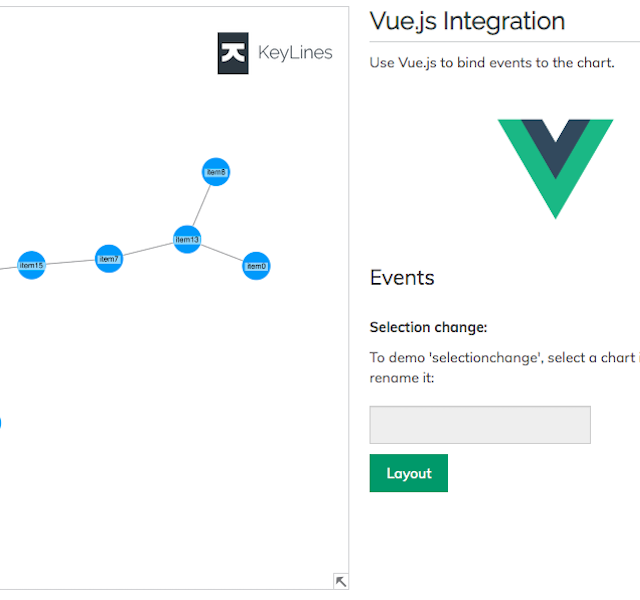
Enjoy the Vue (integration) with KeyLines
Christian Miles VP of Sales
13th November, 2017 | 6 min read
This blog explores the Vue JavaScript framework, and how it can help you build a KeyLines graph visualization...
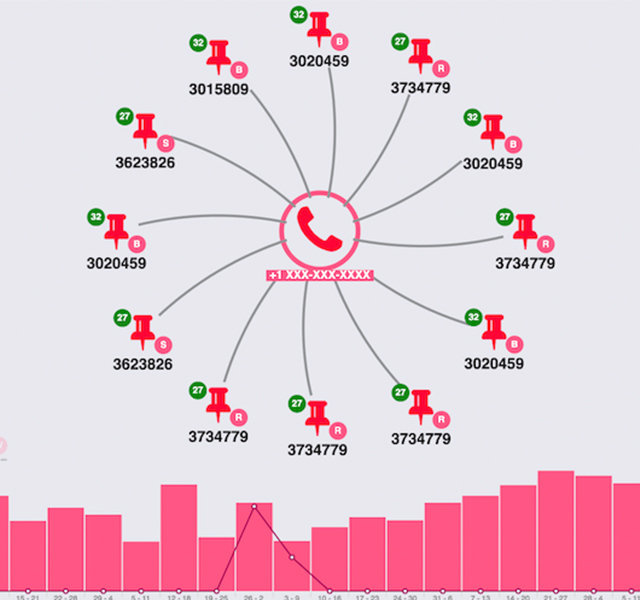
Investigating human trafficking with graph visualization
Christian Miles VP of Sales
29th August, 2017 | 6 min read
Using data from online adverts, we explore a graph visualization-led approach to understanding human trafficking...
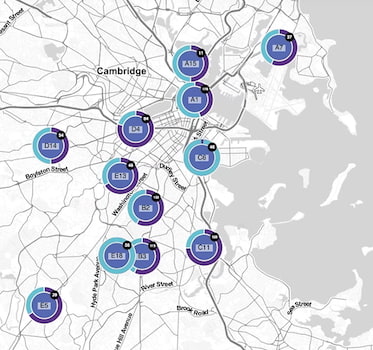
Visualizing crime data at scale
Christian Miles VP of Sales
7th June, 2017 | 6 min read
We take a Neo4j graph database of real-life crime incidents in Boston and apply graph visualization techniques to...
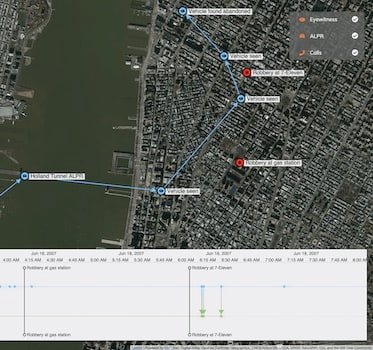
Big data & law enforcement visualizations
Christian Miles VP of Sales
20th February, 2017 | 6 min read
Discover how timeline and graph visualization helps the police harness big data for law enforcement, including...
