Product updates: sharper rectangular combos
Dan Williams Chief Product Officer
31st August, 2021 | 3 min read
Find out what’s new in our latest KeyLines & ReGraph releases. Highlights include improved rectangular...
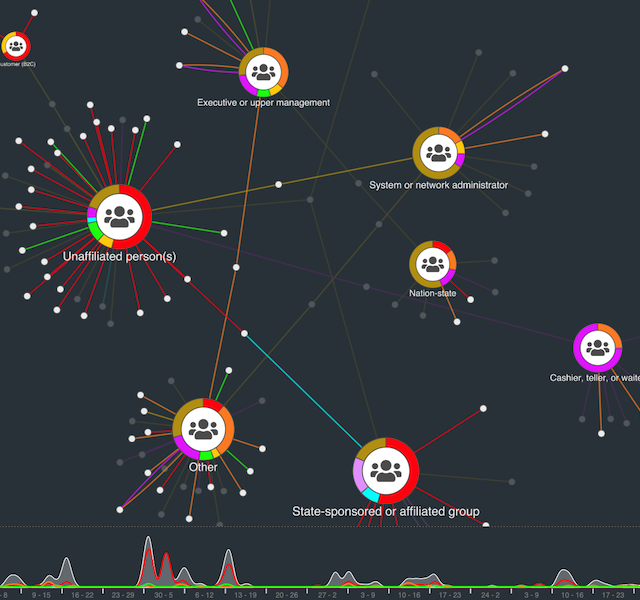
Visualize a cyber attack with the MITRE ATT&CK framework
Dan Williams Chief Product Officer
24th August, 2021 | 7 min read
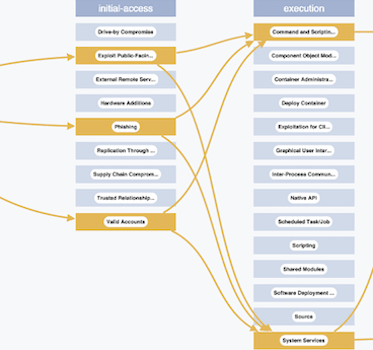
I’ll demonstrate how adding the MITRE ATT&CK framework to your data visualizations can power your...
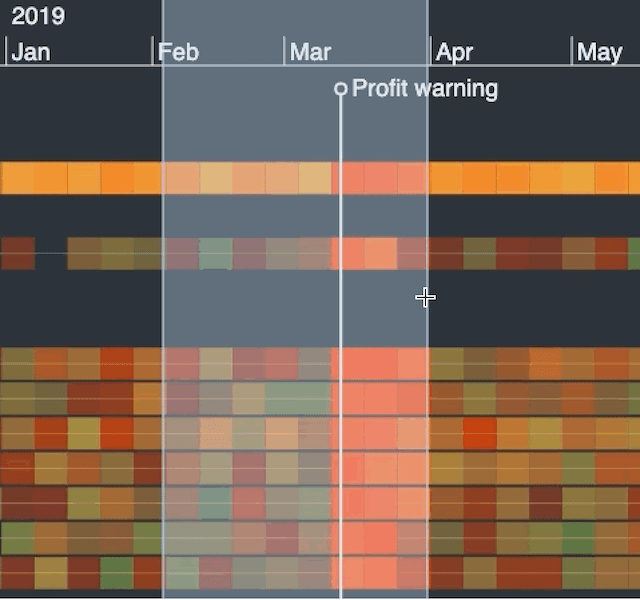
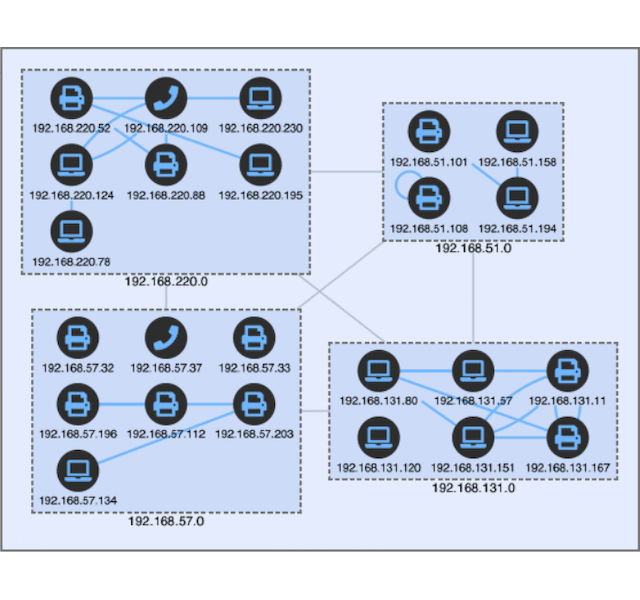
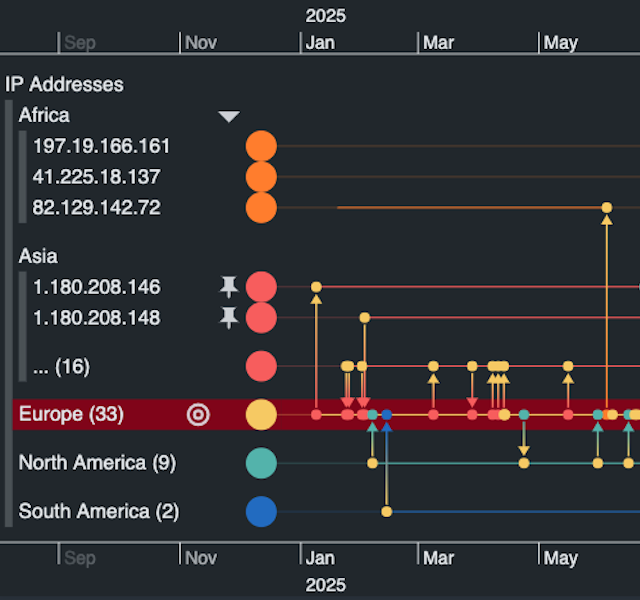
Forensic timeline analysis of network traffic
Dan Williams Chief Product Officer
27th July, 2021 | 9 min read
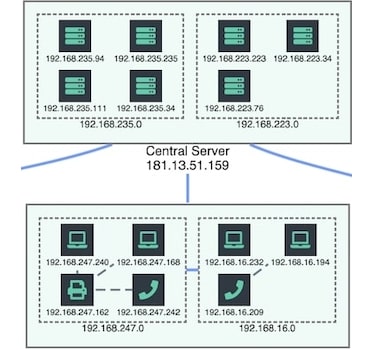
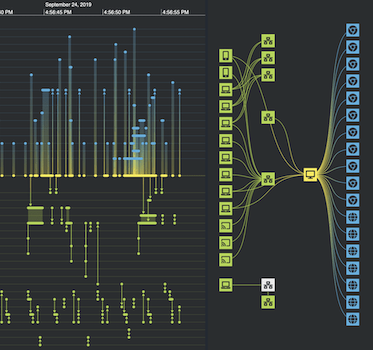
Find out how to use network visualization and forensic timeline analysis to make sense of complex, high-velocity...
The best data flow visualization analysis tools
Dan Williams Chief Product Officer
1st June, 2021 | 8 min read
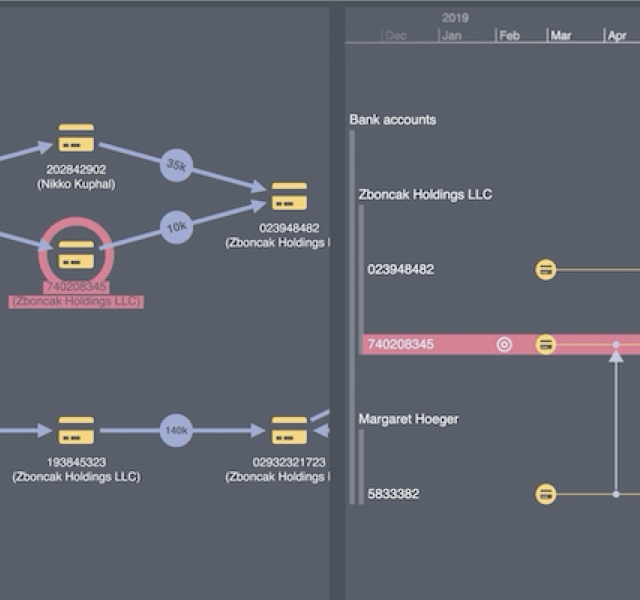
Discover how we use KeyLines & KronoGraph to create flow analysis apps essential for investigating financial...
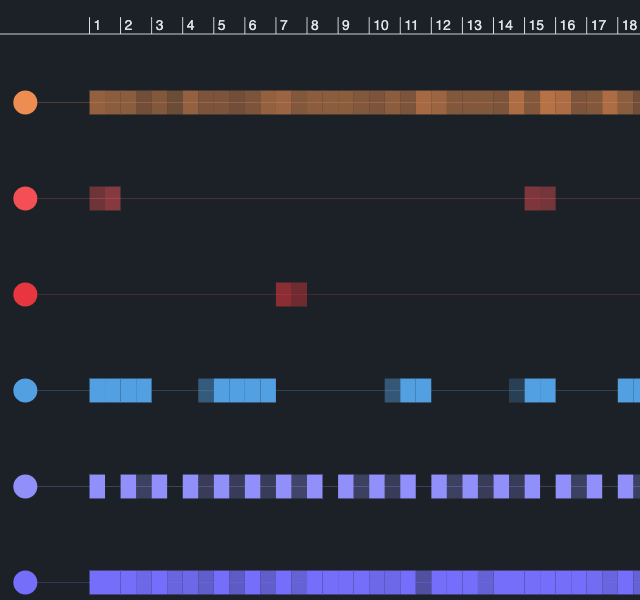
Faster timeline navigation in KronoGraph
Dan Williams Chief Product Officer
10th March, 2021 | 2 min read
KronoGraph users now enjoy faster timeline navigation with support for marquee zoom, plus an updated Storybook and...
KronoGraph update: new timeline scale wrapping
Dan Williams Chief Product Officer
9th February, 2021 | 3 min read
KronoGraph 1.1, our timeline visualization tool, has a clever timeline scale wrapping feature for exploring...
Product updates: a new angle on combos
Dan Williams Chief Product Officer
8th December, 2020 | 4 min read
Our latest toolkit updates include rectangular combos, a revised KeyLines Neo4j tutorial, and ReGraph support for...
Here’s KronoGraph, our timeline visualization toolkit
Dan Williams Chief Product Officer
1st December, 2020 | 3 min read
We’re excited to announce the release of KronoGraph 1.0: the first developer toolkit for building scalable,...
Malware investigation tools for cyber analysts
Dan Williams Chief Product Officer
20th November, 2020 | 5 min read
How to build engaging and useful data visualization tools for cyber security analysts, from cyber threat...
