Open source vs. commercial: We compare KeyLines and D3
Ryan Shimmon Commercial Software Developer
10th March, 2026 | 11 min read
KeyLines vs D3.js: we built the same graph visualization in both and benchmarked the results. See which delivers...
Ryan Shimmon Commercial Software Developer
10th March, 2026 | 11 min read
KeyLines vs D3.js: we built the same graph visualization in both and benchmarked the results. See which delivers...
Rosy Hunt Content Marketing Specialist
26th October, 2025 | 13 min read
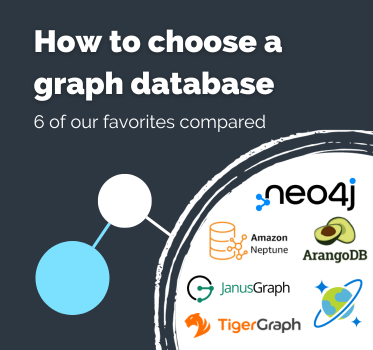
If you’ve found this article, the chances are you: Need to build a powerful graph or graph analytics application...
Zach Mason Product Designer
24th June, 2025 | 18 min read
We share expert graph visualization UX principles that make the difference between user frustration and...
Alejandro Lemus Account Executive
20th February, 2025 | 9 min read
Summary: This article looks at five open-source data visualization libraries that teams often use when prototyping...

Jan Girman Product Manager
19th November, 2024 | 12 min read
This blog post explores how graph visualization brings digital twins to life. Before joining Cambridge...

Thomas Chan Software Developer
20th August, 2024 | 10 min read
Web developers face a long list of time-consuming challenges. From designing an outstanding UX to building a site...
Catherine Kearns Content Strategist & Team Lead
15th May, 2024 | 14 min read
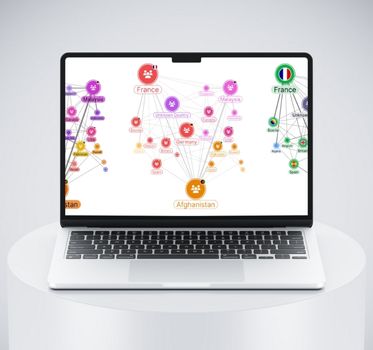
Every analyst and investigator relies on tried and tested methods to solve crimes, uncover threats and identify...
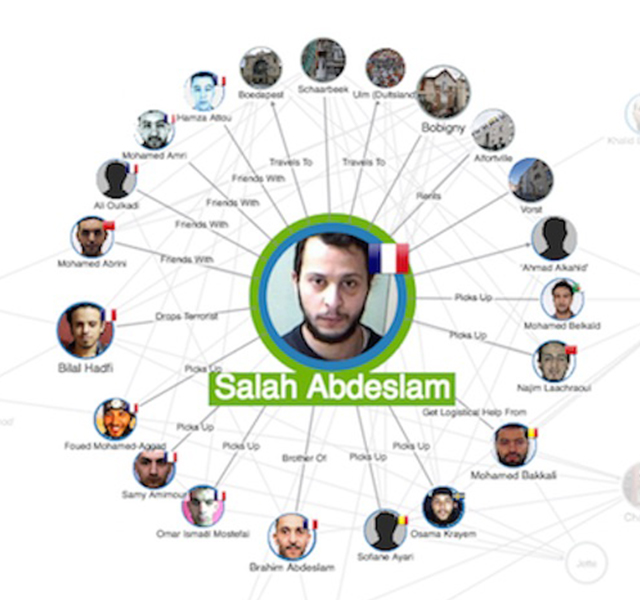
Andrew Disney Marketing Director
12th May, 2024 | 11 min read
We explore the top real-world data visualization use cases, starting with law enforcement and fraud...

Paige Hollier Account Executive
11th April, 2024 | 7 min read
This blog post investigates misinformation and disinformation – what it is, why it’s harmful, and what’s...
Registered in England and Wales with Company Number 07625370 | VAT Number 113 1740 61
6-8 Hills Road, Cambridge, CB2 1JP. All material © Cambridge Intelligence .
Privacy Policy | Security Framework
