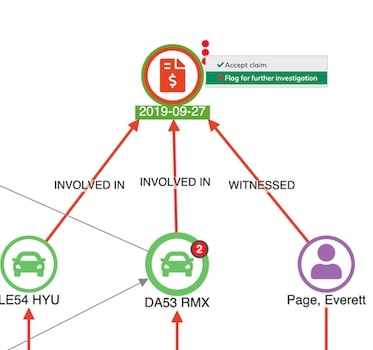
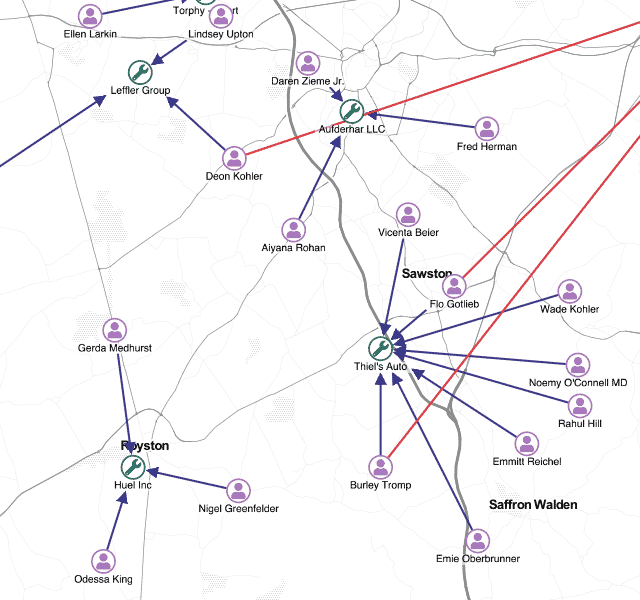
Link analysis for fraud detection
Andrew Disney Marketing Director
30th January, 2020 | 5 min read
Discover how to use link analysis techniques for fraud detection in this step-by-step example showing typical...
Andrew Disney Marketing Director
30th January, 2020 | 5 min read
Discover how to use link analysis techniques for fraud detection in this step-by-step example showing typical...
Corey Lanum Chief Product Evangelist
23rd January, 2020 | 7 min read
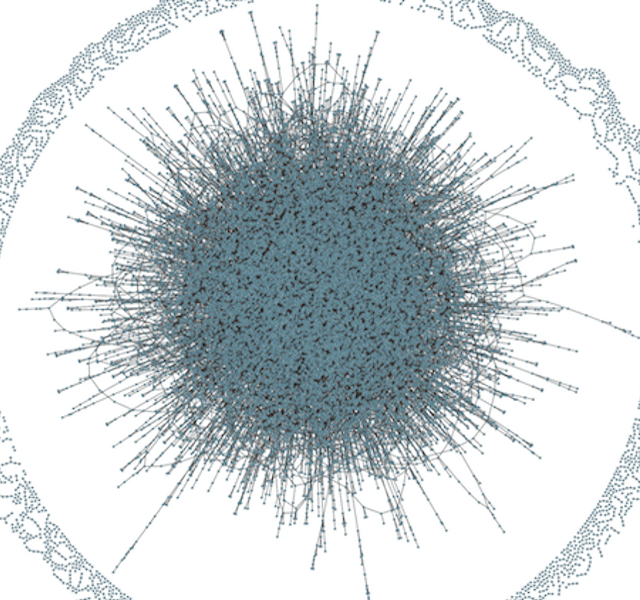
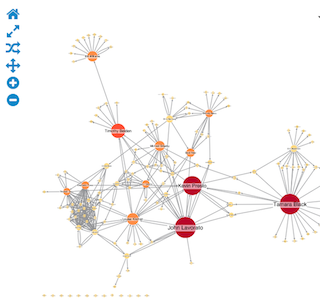
Successful graph visualization at scale: proven strategies to visualize your graph data at scale and still uncover...
Andrew Disney Marketing Director
7th January, 2020 | 8 min read
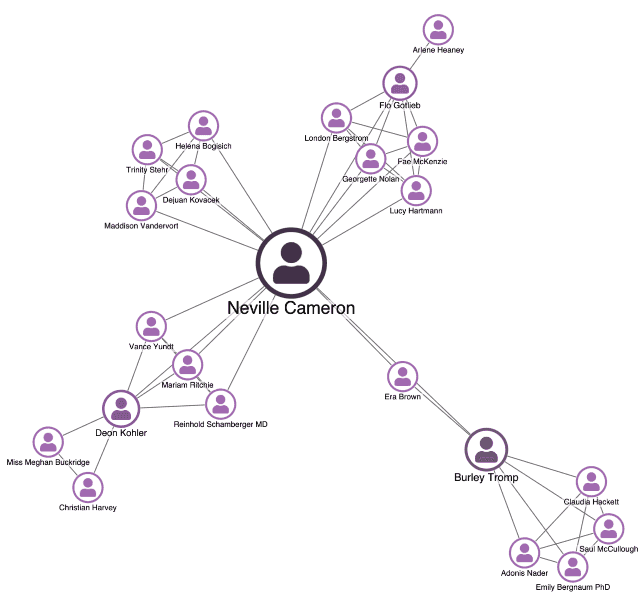
Are you trying to create effective data models for graph visualizations? Do your users find insight in connected...
Andrew Disney Marketing Director
2nd January, 2020 | 5 min read
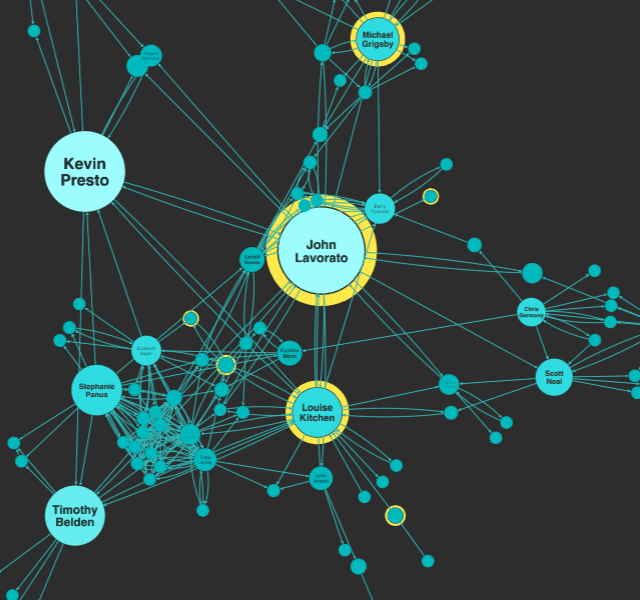
Here’s everything you need to get started with centrality measures: what they are, what they tell us and...
Kevin Naughten Senior Product Manager
15th July, 2019 | 6 min read
Let’s create visual models that deliver the best user experience (UX). Detailed graph visualizations from an...
Christian Miles VP of Sales
18th June, 2018 | 5 min read
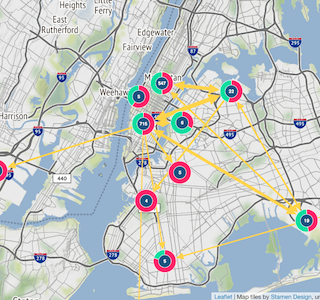
In this blog, we use a New York taxi cab database to show how graph visualization can be useful when working with...
Andrew Disney Marketing Director
18th May, 2018 | 4 min read
Discover the benefits of graph visualization and why it should be a core part of your web application – it’s...
Dan Williams Chief Product Officer
12th March, 2018 | 5 min read
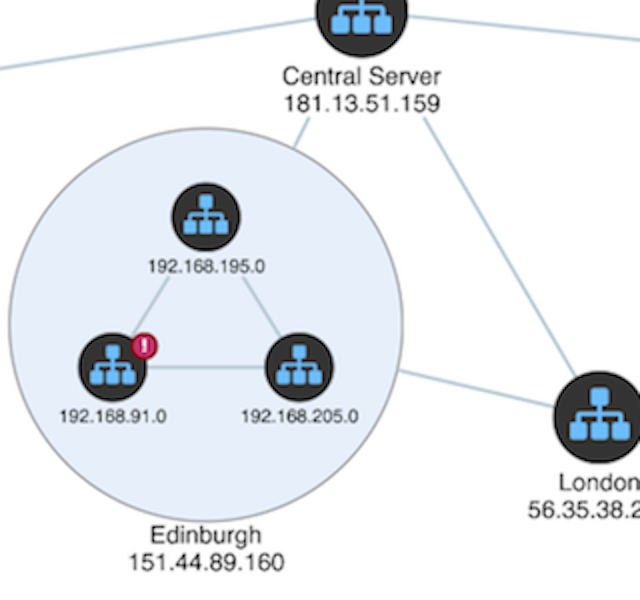
In this blog post, we’ll show you how network visualization can make alert detection and investigation more...

Dan Williams Chief Product Officer
9th February, 2018 | 6 min read
In this blog post we explore open source code libraries versus commercial SDKs to show why Cambridge...
Registered in England and Wales with Company Number 07625370 | VAT Number 113 1740 61
6-8 Hills Road, Cambridge, CB2 1JP. All material © Cambridge Intelligence .
Privacy Policy | Security Framework
