Malware investigation tools for cyber analysts
Dan Williams Head of Product Management
20th November, 2020 | 5 min read
How to build engaging and useful data visualization tools for cyber security analysts, from cyber threat...
Dan Williams Head of Product Management
20th November, 2020 | 5 min read
How to build engaging and useful data visualization tools for cyber security analysts, from cyber threat...
Dan Williams Head of Product Management
11th August, 2020 | 8 min read
With examples from the cyber security world, this blog focuses on six clever customization options in KeyLines and...
Andrew Disney Marketing Director
20th April, 2020 | 6 min read
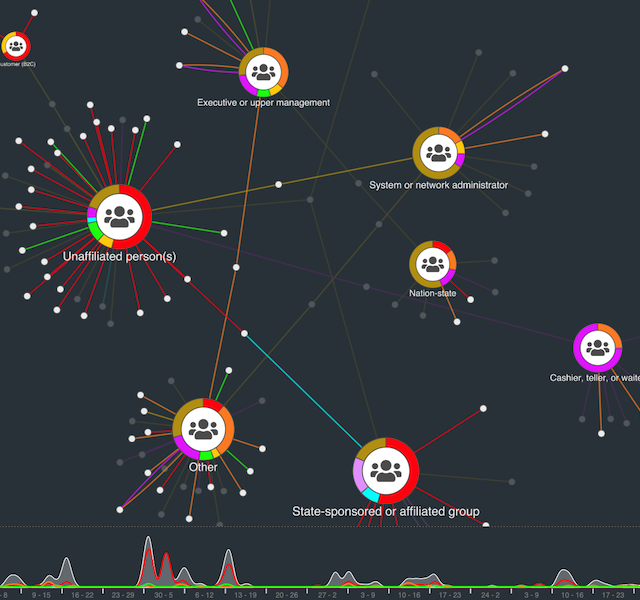
Visualizing the VERIS community database of data breaches: How graph visualization can help us extract insight...
Andrew Disney Marketing Director
25th September, 2017 | 4 min read
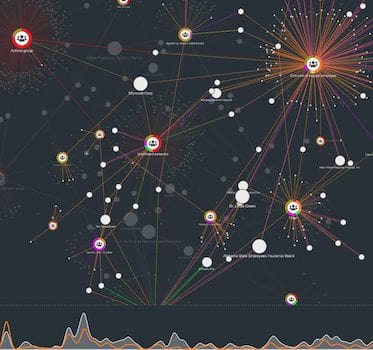
Let’s explore the role of graph visualization in helping cyber security analysts overcome the scale and...
Andrew Disney Marketing Director
12th May, 2017 | 5 min read
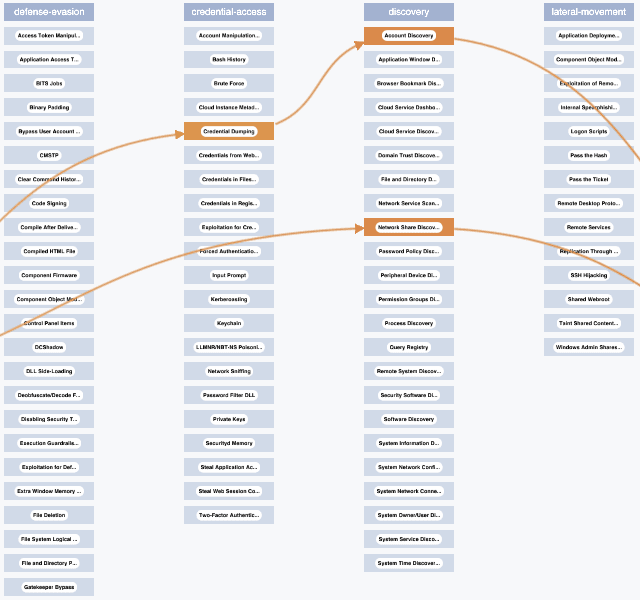
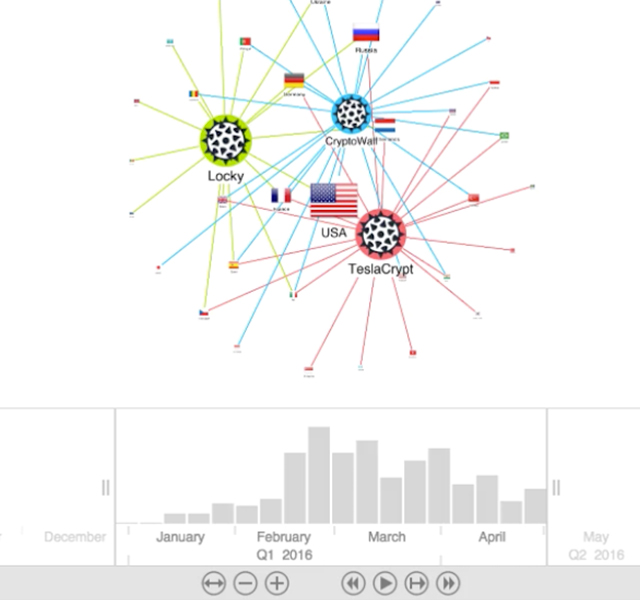
This post explores how KeyLines graph visualization simplifies complex Malware networks, making post-attack...
Andrew Disney Marketing Director
21st February, 2017 | 4 min read
We’ll explore how Devo empowers analysts to harness the connections in their big data, with the help of the...

Andrew Disney Marketing Director
6th April, 2016 | 4 min read
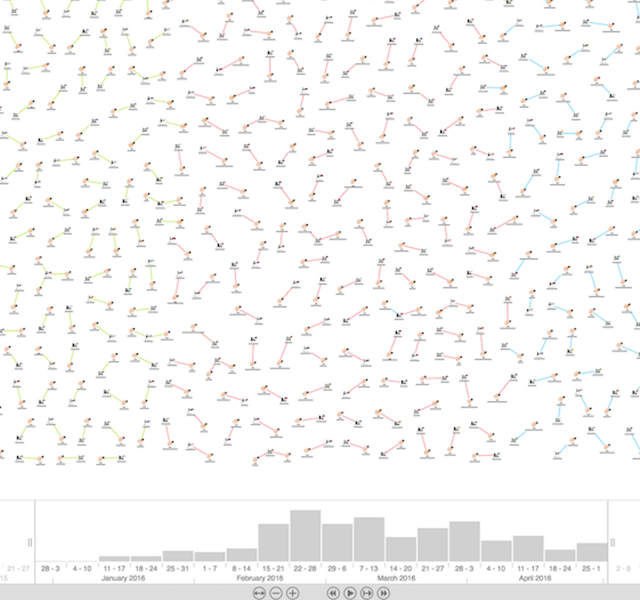
There are lots of ways for a cyber security analyst to look at their data – as tables, bar charts, line...

Andrew Disney Marketing Director
13th January, 2016 | 4 min read
Learn how cyber security start-up, EclecticIQ, launched a pioneering threat intelligence platform including a...
Andrew Disney Marketing Director
13th January, 2016 | 5 min read
Cyber intelligence data is big, complex and varied. Graph visualization is fast becoming a ‘must-have’...