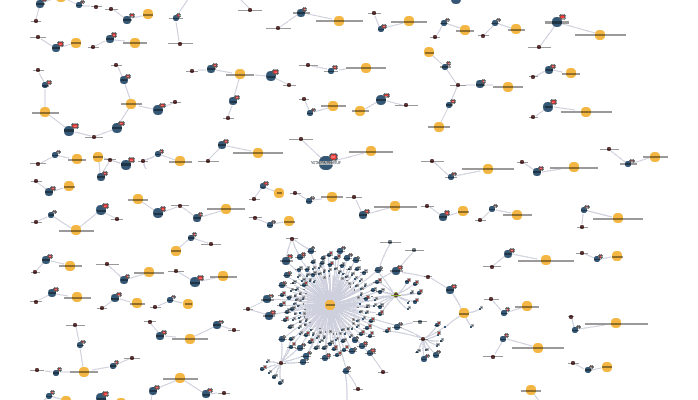
Visualizing restricted substances for REACH compliance
Dan Williams Chief Product Officer
13th June, 2017 | 6 min read
Using connected data visualization techniques to manage supply chain risk, ensure restricted substance compliance...
Dan Williams Chief Product Officer
13th June, 2017 | 6 min read
Using connected data visualization techniques to manage supply chain risk, ensure restricted substance compliance...
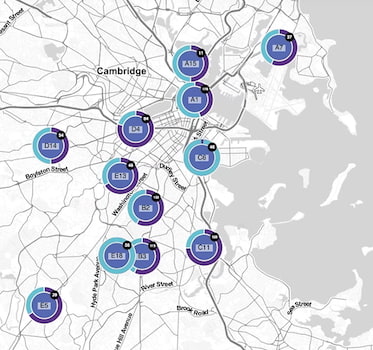
Christian Miles VP of Sales
7th June, 2017 | 6 min read
We take a Neo4j graph database of real-life crime incidents in Boston and apply graph visualization techniques to...
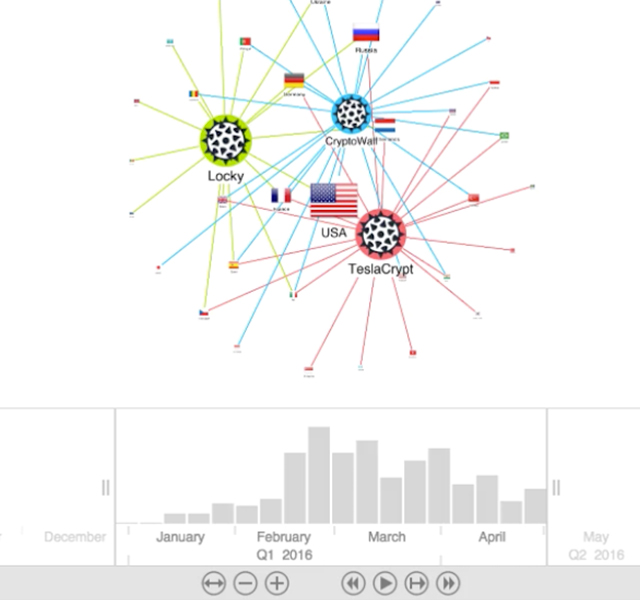
Andrew Disney Marketing Director
12th May, 2017 | 5 min read
This post explores how KeyLines graph visualization simplifies complex Malware networks, making post-attack...
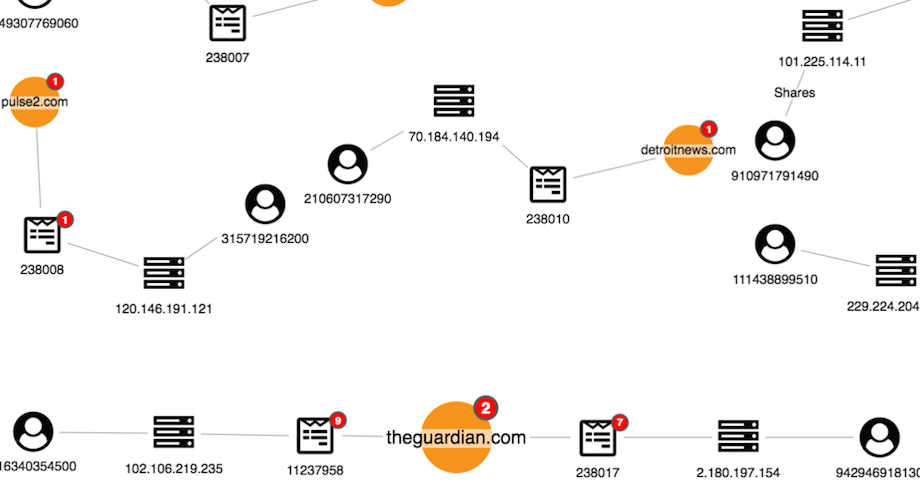
Andrew Disney Marketing Director
28th February, 2017 | 8 min read
Fake news is nothing new – bad journalism and propaganda have always existed – but recent concerns about its...
Andrew Disney Marketing Director
21st February, 2017 | 4 min read
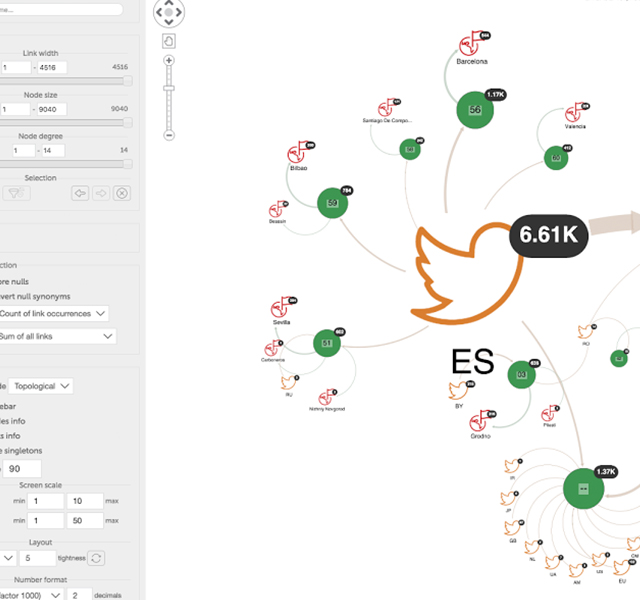
We’ll explore how Devo empowers analysts to harness the connections in their big data, with the help of the...
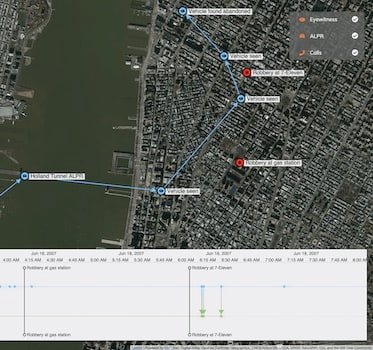
Christian Miles VP of Sales
20th February, 2017 | 6 min read
Discover how timeline and graph visualization helps the police harness big data for law enforcement, including...

Andrew Disney Marketing Director
10th January, 2017 | 4 min read
Identifying Threat, Risk & Harm KeyLines has been incorporated into a new Microsoft Services platform for UK...
Andrew Disney Marketing Director
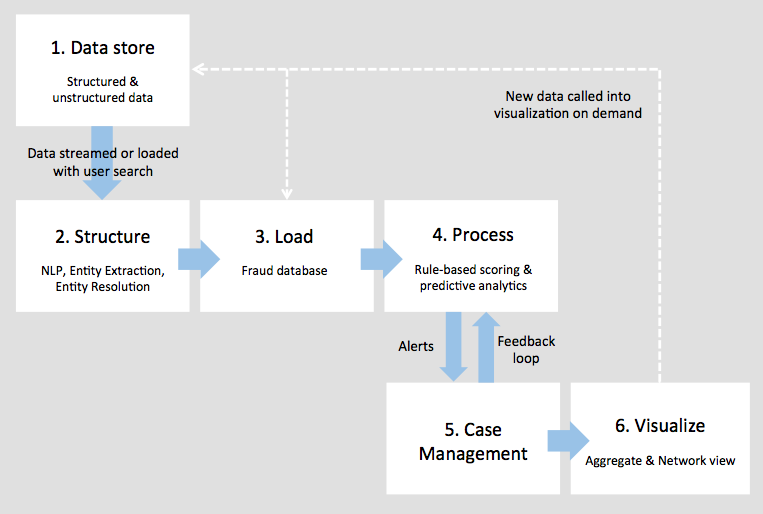
15th November, 2016 | 6 min read
The best fraud detection processes use the right tools at every stage. Find out how important KeyLines and link...

Andrew Disney Marketing Director
6th April, 2016 | 4 min read
There are lots of ways for a cyber security analyst to look at their data – as tables, bar charts, line...
Registered in England and Wales with Company Number 07625370 | VAT Number 113 1740 61
6-8 Hills Road, Cambridge, CB2 1JP. All material © Cambridge Intelligence .
Privacy Policy | Security Framework
