Azure Cosmos DB tutorial for KronoGraph & KeyLines
Corey Lanum Chief Product Evangelist
21st November, 2023 | 19 min read
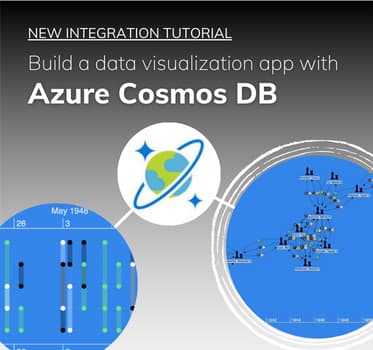
This Azure Cosmos DB tutorial shows you how to integrate Microsoft’s multi-model database service with our graph...
Corey Lanum Chief Product Evangelist
21st November, 2023 | 19 min read
This Azure Cosmos DB tutorial shows you how to integrate Microsoft’s multi-model database service with our graph...
Corey Lanum Chief Product Evangelist
14th November, 2023 | 15 min read
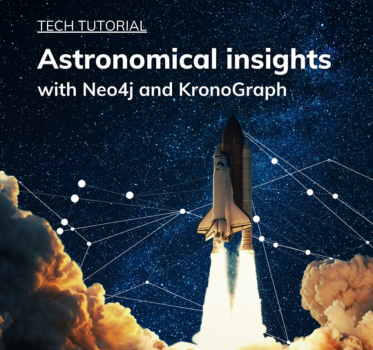
In this tutorial, you’ll find out how to use Neo4j and KronoGraph to create an interactive timeline...

Andrew Disney Marketing Director
13th November, 2023 | 2 min read
Together with our partners at Sistemi & Automazione, we’ve secured a tender to provide Italy’s central...
Khadeja Sajjad Software Developer
9th November, 2023 | 8 min read
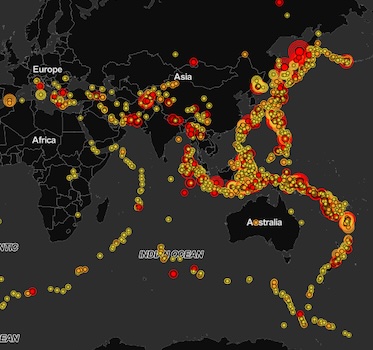
Analysts rely on our data visualization toolkits to spot hidden patterns in their visualized data. They...
Corey Lanum Chief Product Evangelist
31st October, 2023 | 6 min read
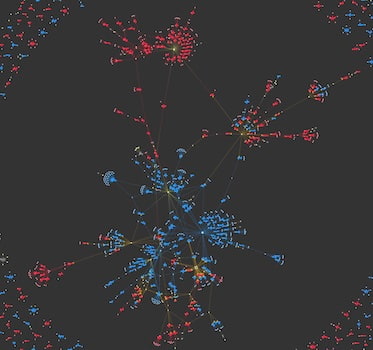
I use graph visualization to reveal insights in US election campaign data: which orgs donate to both Republican...
Corey Lanum Chief Product Evangelist
25th October, 2023 | 12 min read
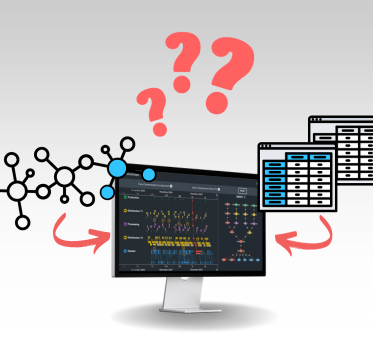
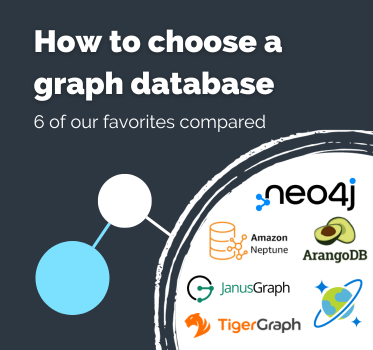
What datastore is best for visualizing graph data? Graph databases are often a great fit, but you have more...
Andrew Disney Marketing Director
19th October, 2023 | 12 min read
If you’ve found this article, the chances are you: Need to build a powerful graph or graph analytics application...
Bonney O'Hanlon Product Manager
17th October, 2023 | 2 min read
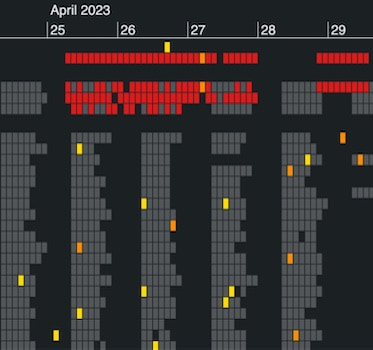
The latest version of KronoGraph, our timeline visualization SDK, includes more ways to customize heatmap cells...
Rosy Hunt Content Marketing Specialist
5th October, 2023 | 3 min read
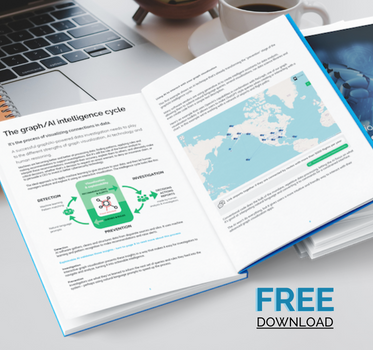
Artificial intelligence promises a positive shift in practice for businesses across domains from cybersecurity,...