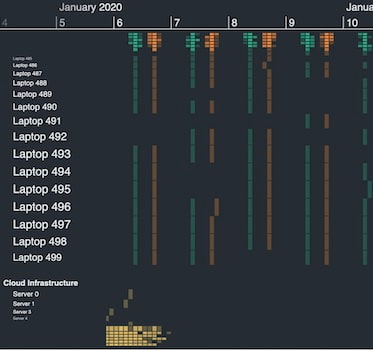
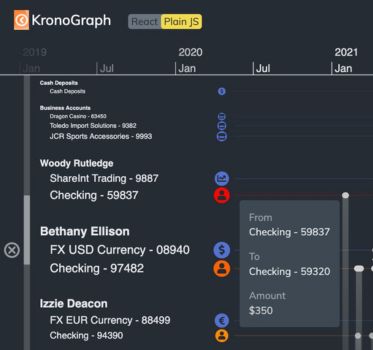
Product update: manage large datasets with ease
Bonney O'Hanlon Product Manager
4th July, 2023 | 3 min read
KronoGraph 2.5 – the latest version of our timeline visualization toolkit – is now available to...
Bonney O'Hanlon Product Manager
4th July, 2023 | 3 min read
KronoGraph 2.5 – the latest version of our timeline visualization toolkit – is now available to...
Julia Robson Principal Team Lead
28th June, 2023 | 10 min read
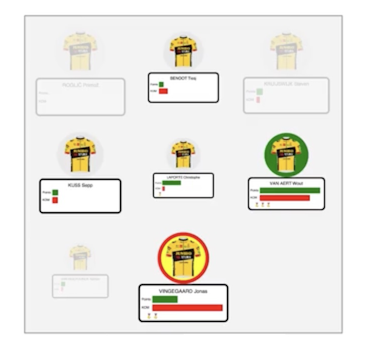
On Saturday 24th June 2023, I set off from Bilbao, Spain, to ride the Tour de France route with Le Loop. In the...
Andrew Disney Marketing Director
21st June, 2023 | 6 min read
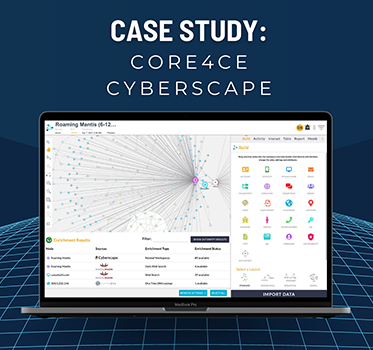
See how Core4ce use KeyLines-powered visualizations to help keep critical systems safe from cyber...
Corey Lanum Chief Product Evangelist
31st May, 2023 | 6 min read
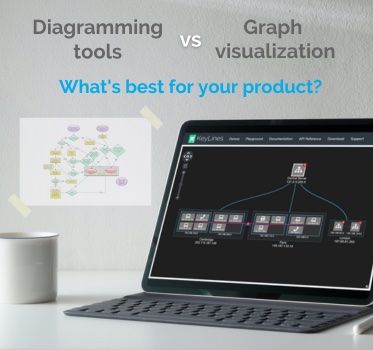
When diagramming tools aren’t working hard enough for you, it’s time to upgrade to the insightful...
Kevin Naughten Senior Product Manager
30th May, 2023 | 3 min read
KeyLines 7.1 & ReGraph 4.1 feature big performance gains and greater flexibility for our popular sequential...
Dan Williams Chief Product Officer
25th May, 2023 | 3 min read
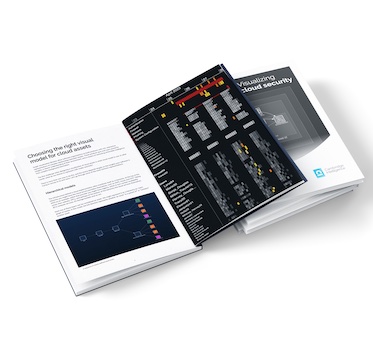
As companies move their digital infrastructure to the cloud, and as Infrastructure as a Service (IaaS) becomes the...
Bonney O'Hanlon Product Manager
18th May, 2023 | 4 min read
KronoGraph 2.4 introduces duration markers and enhanced styling options to make the important characteristics of...

Alejandro Lemus Account Executive
9th May, 2023 | 10 min read
How do senior management teams prioritize cyber threat detection? We look at key trends from the latest reports,...

Corey Lanum Chief Product Evangelist
25th April, 2023 | 10 min read
How do you measure the value of adding data visualization to your web app? If you choose to build a visualization...
Registered in England and Wales with Company Number 07625370 | VAT Number 113 1740 61
6-8 Hills Road, Cambridge, CB2 1JP. All material © Cambridge Intelligence .
Privacy Policy | Security Framework
