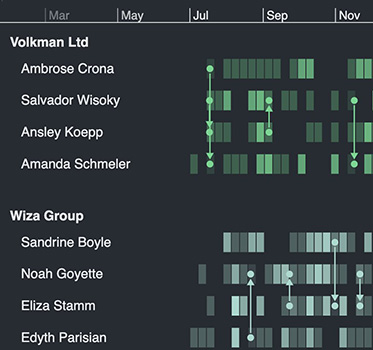
Product update: Heatmaps with more 🔥
Matt Latham Product Manager
24th November, 2022 | 2 min read
We’ve just released KronoGraph 2.1, packed with new features to help analysts spot patterns, understand context...
Matt Latham Product Manager
24th November, 2022 | 2 min read
We’ve just released KronoGraph 2.1, packed with new features to help analysts spot patterns, understand context...

Catherine Kearns Content Strategist & Team Lead
1st November, 2022 | 2 min read
The latest updates to our graph visualization toolkits bring KronoGraph 2.0’s exciting new features to our...

Corey Lanum Chief Product Evangelist
25th October, 2022 | 11 min read
Graph visualization is a serious business. But there’s no denying that graphs can also be fun. In this blog...
Catherine Kearns Content Strategist & Team Lead
11th October, 2022 | 7 min read
This post shows how unique navigation features in KronoGraph, our time-based visual analytics SDK, help analysts...
Catherine Kearns Content Strategist & Team Lead
6th October, 2022 | 3 min read
The latest major release of KronoGraph – the timeline visualization SDK – has arrived! Discover the...
Matt Latham Product Manager
5th October, 2022 | 4 min read
Learn about KronoGraph 2.0: the only timeline analysis tool that lets users combine thousands of timelines into a...
Kevin Naughten Senior Product Manager
27th September, 2022 | 2 min read
The latest releases of our graph visualization SDKs bring more control over combos, and a live coding environment...

Christian Lentfort Developer
13th September, 2022 | 13 min read
We bootstrapped RedwoodJS to ReGraph, our data visualization toolkit for React developers, to build an app that...
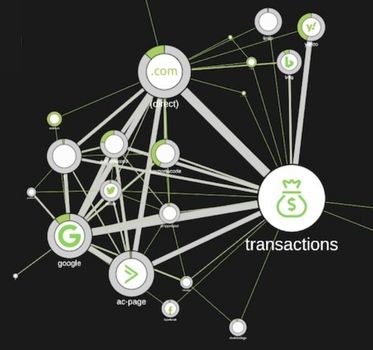
Rosy Hunt Content Marketing Specialist
30th August, 2022 | 7 min read
In marketing, ‘attribution’ can be a dirty word. It’s all about tracking human behavior, and using that data...
Registered in England and Wales with Company Number 07625370 | VAT Number 113 1740 61
6-8 Hills Road, Cambridge, CB2 1JP. All material © Cambridge Intelligence .
Privacy Policy | Security Framework
