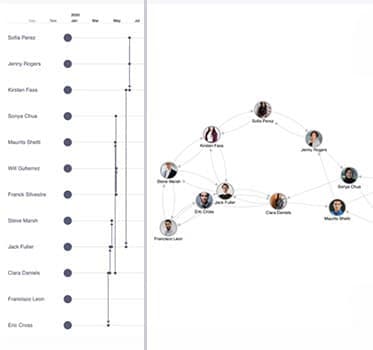
The ultimate guide to timeline data modeling
Dan Williams Chief Product Officer
16th August, 2022 | 8 min read
Want to know how to do timeline data modeling? We explore best practices with real-world examples of the best...
Dan Williams Chief Product Officer
16th August, 2022 | 8 min read
Want to know how to do timeline data modeling? We explore best practices with real-world examples of the best...
Corey Lanum Chief Product Evangelist
2nd August, 2022 | 13 min read
In this technical blog post, I show you how to get KeyLines, our JavaScript toolkit for graph visualization,...
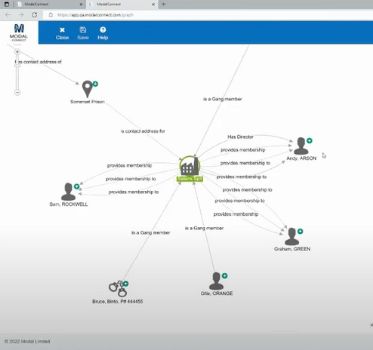
Rosy Hunt Content Marketing Specialist
19th July, 2022 | 6 min read
Find out how ModalConnect use our graph visualization technology to power the advanced visual analytics in their...
Andrew Disney Marketing Director
5th July, 2022 | 7 min read
In this blog post, we’ll see how C3 AI – the enterprise AI pioneers – uses graph and timeline...

Rosy Hunt Content Marketing Specialist
23rd June, 2022 | 2 min read
After two years of virtual company socials we rediscovered the great outdoors together last week, at our belated...
Rosy Hunt Content Marketing Specialist
20th June, 2022 | 6 min read
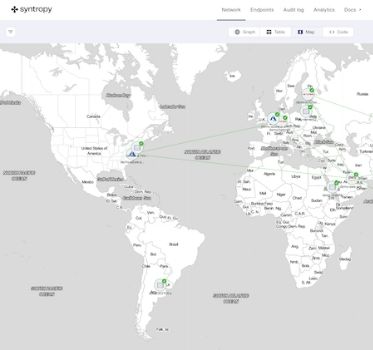
In this blog you’ll see how Syntropy, a global team of web3 pioneers, use our network visualization toolkits to...
Julia Robson Principal Team Lead
15th June, 2022 | 6 min read
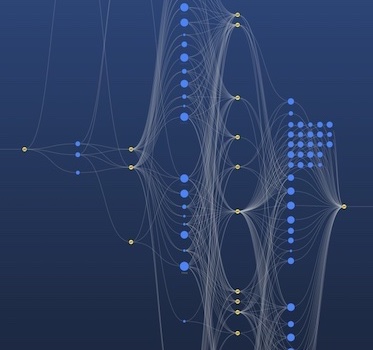
Sequential layout is the best choice for tiered data containing distinct levels of nodes. Find out what makes it...

Dan Williams Chief Product Officer
31st May, 2022 | 2 min read
The latest updates to our graph visualization toolkits include new testing APIs and a live-coding...
Matt Latham Product Manager
24th May, 2022 | 4 min read
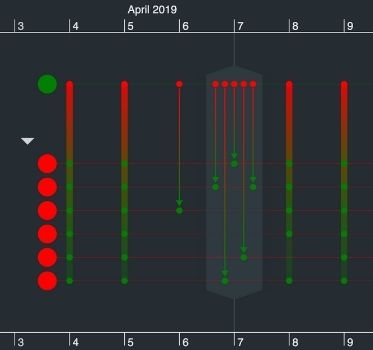
The latest KronoGraph versions offer some visually stunning features and enhancements to inspire your...
Registered in England and Wales with Company Number 07625370 | VAT Number 113 1740 61
6-8 Hills Road, Cambridge, CB2 1JP. All material © Cambridge Intelligence .
Privacy Policy | Security Framework
