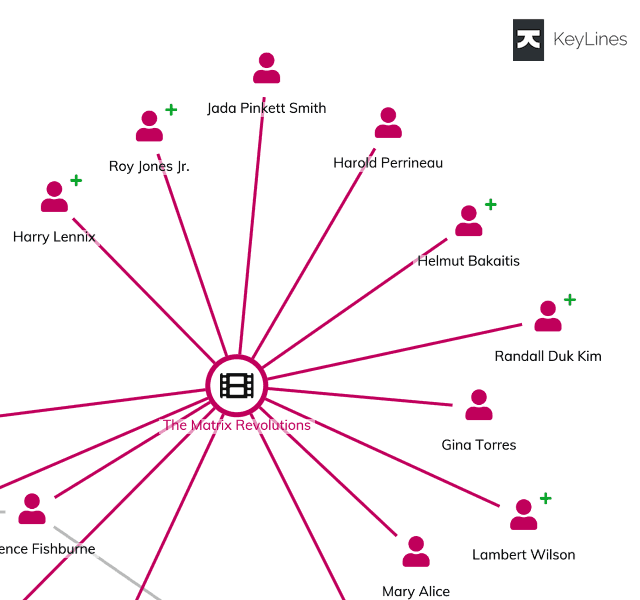
Graph visualization: the basics
Catherine Kearns Content Strategist & Team Lead
21st April, 2020 | 15 min read
A non-technical, high-level introduction to graphs, graph models, graph databases and graph...
Catherine Kearns Content Strategist & Team Lead
21st April, 2020 | 15 min read
A non-technical, high-level introduction to graphs, graph models, graph databases and graph...
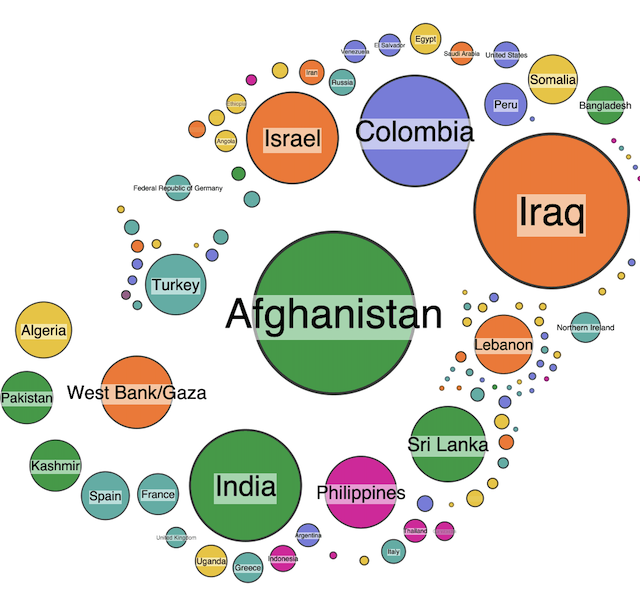
Andrew Disney Marketing Director
20th April, 2020 | 6 min read
Visualizing the VERIS community database of data breaches: How graph visualization can help us extract insight...
Dan Williams Chief Product Officer
6th April, 2020 | 7 min read
The first step in the data cleansing process is understanding where data quality issues exist. In this blog post...
Catherine Kearns Content Strategist & Team Lead
16th March, 2020 | 5 min read
ReGraph’s powerful rendering gives your analysts the quality and speed they expect from a superior graph...
Christian Miles VP of Sales
17th February, 2020 | 7 min read
This step-by-step developer tutorial describes how to integrate KeyLines with Amazon Neptune using AWS...
Christian Miles VP of Sales
3rd February, 2020 | 10 min read
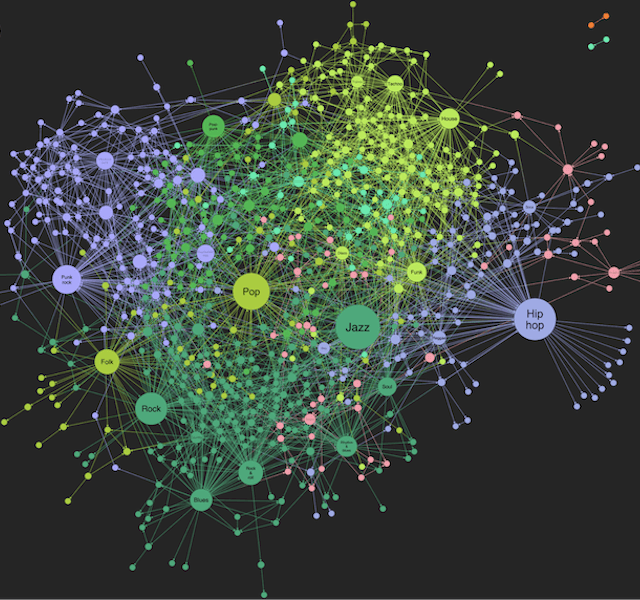
In this developer tutorial, we’ll use SPARQL to query a DBpedia knowledge graph visualization of connections...
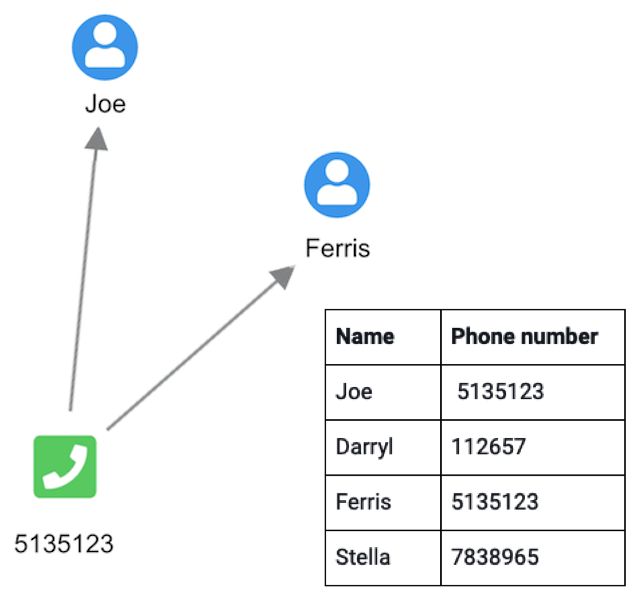
Andrew Disney Marketing Director
30th January, 2020 | 5 min read
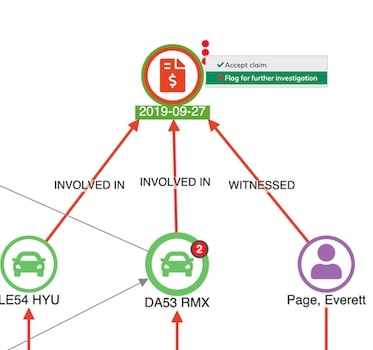
Discover how to use link analysis techniques for fraud detection in this step-by-step example showing typical...
Corey Lanum Chief Product Evangelist
23rd January, 2020 | 7 min read
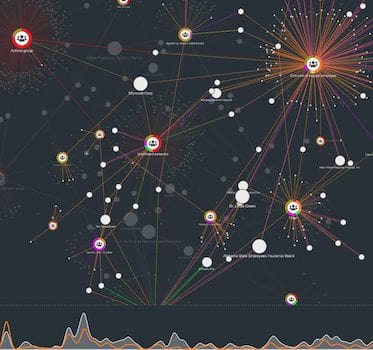
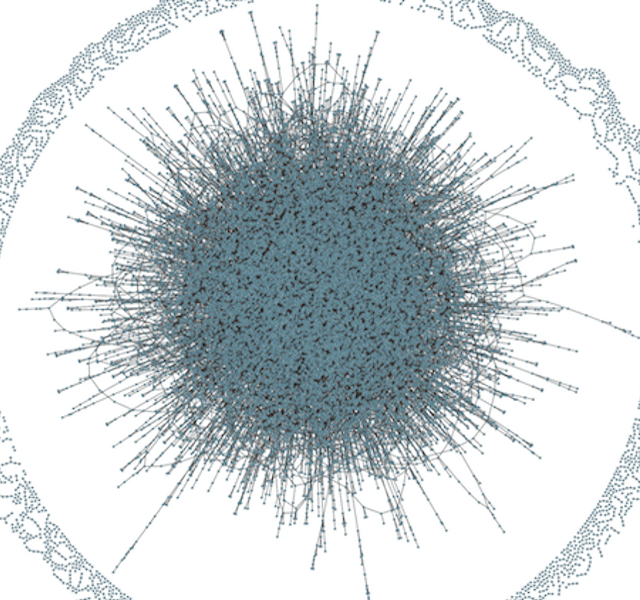
Successful graph visualization at scale: proven strategies to visualize your graph data at scale and still uncover...

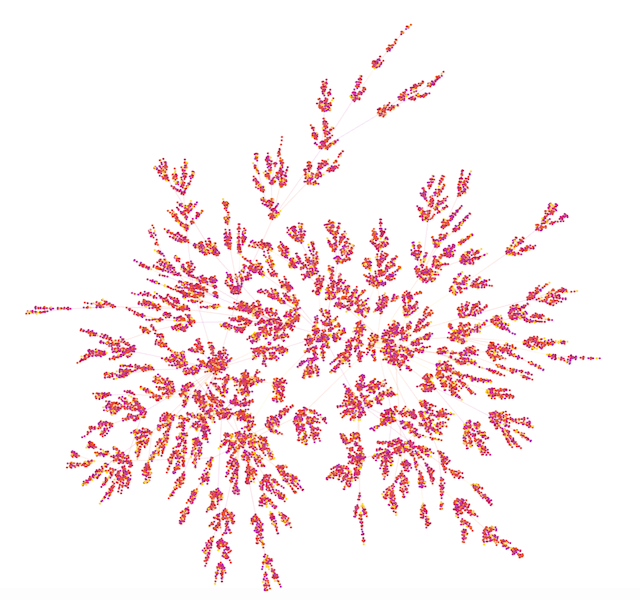
Dan Williams Chief Product Officer
20th January, 2020 | 8 min read
A starburst is when one heavily connected node dominates your graph visualization. It’s a common problem...
Registered in England and Wales with Company Number 07625370 | VAT Number 113 1740 61
6-8 Hills Road, Cambridge, CB2 1JP. All material © Cambridge Intelligence .
Privacy Policy | Security Framework
