
Python graph visualization using Jupyter & ReGraph
Catherine Kearns Content Strategist & Team Lead
27th October, 2020 | 12 min read
In this blog post we’ll show you how quick and easy it is to integrate JupyterLab and ReGraph to create...
Catherine Kearns Content Strategist & Team Lead
27th October, 2020 | 12 min read
In this blog post we’ll show you how quick and easy it is to integrate JupyterLab and ReGraph to create...
Dan Williams Chief Product Officer
20th October, 2020 | 5 min read
React devs: find out how quick and easy it is to build a simple React application using KronoGraph, our timeline...
Andrew Disney Marketing Director
29th September, 2020 | 6 min read
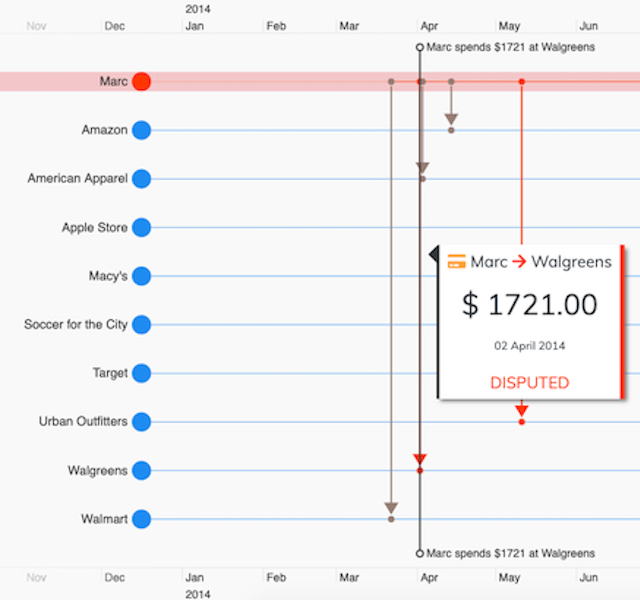
Building timeline visualization tools for fraud investigations, using the KronoGraph timeline visualization...
Dan Williams Chief Product Officer
22nd September, 2020 | 7 min read
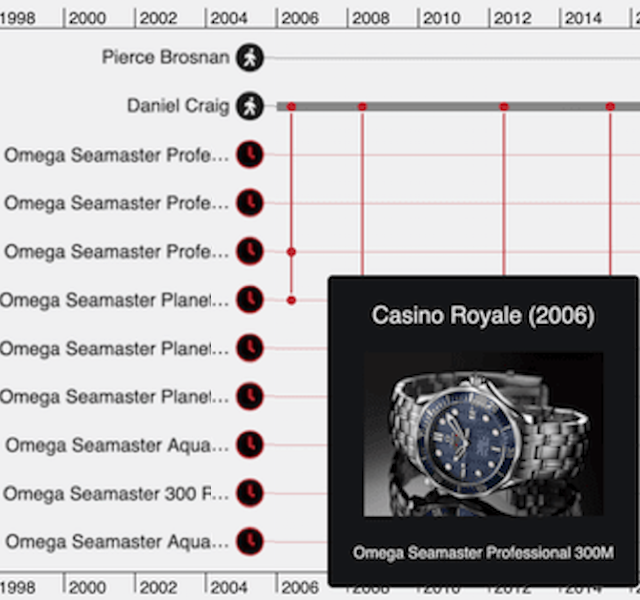
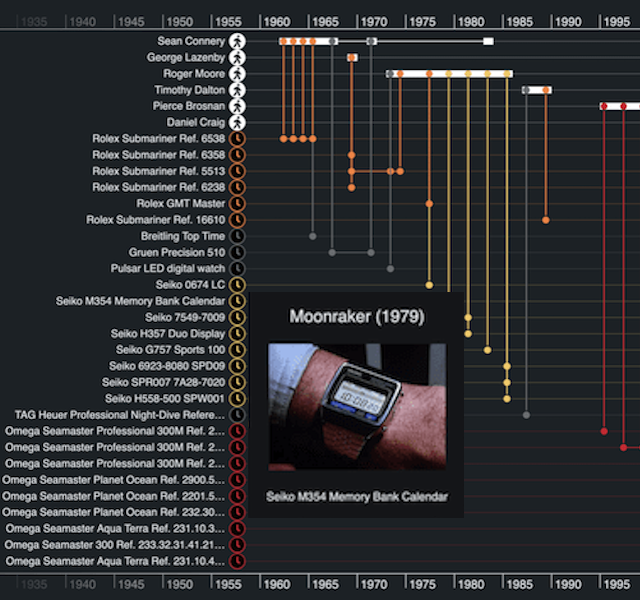
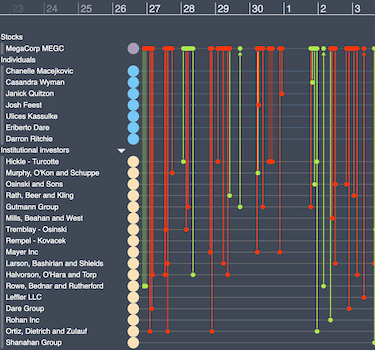
Follow this tutorial to build KronoGraph timeline visualizations with JavaScript. We’ll also analyze James...
Dan Williams Chief Product Officer
15th September, 2020 | 7 min read
Our timeline visualization toolkit, KronoGraph, is for those who want to build rich, interactive timelines into...
Catherine Kearns Content Strategist & Team Lead
8th September, 2020 | 2 min read
Cambridge Intelligence, creators of data visualization technologies that make the world safer, today announced...
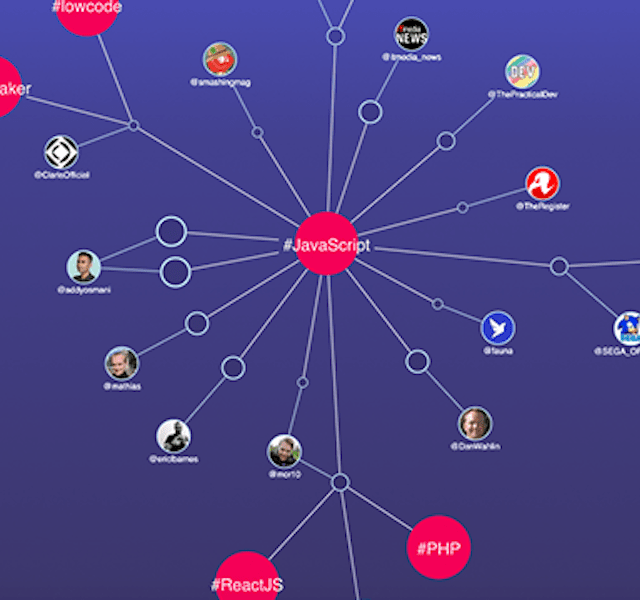
Christian Lentfort Developer
1st September, 2020 | 13 min read
Our toolkits help you visualize big data. Follow this guide to integrate ReGraph – our toolkit for building...

Catherine Kearns Content Strategist & Team Lead
18th August, 2020 | 7 min read
Find out how GraphAware’s Hume and KeyLines help the European Space Agency see the power of Natural Language...
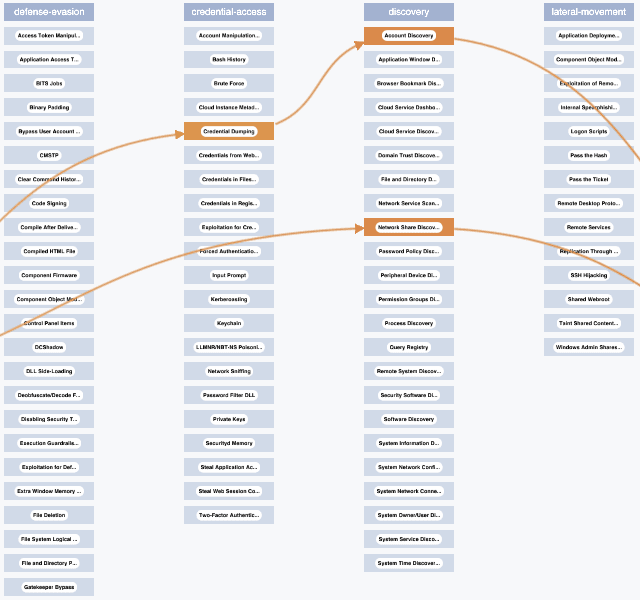
Dan Williams Chief Product Officer
11th August, 2020 | 8 min read
With examples from the cyber security world, this blog focuses on six clever customization options in KeyLines and...
Registered in England and Wales with Company Number 07625370 | VAT Number 113 1740 61
6-8 Hills Road, Cambridge, CB2 1JP. All material © Cambridge Intelligence .
Privacy Policy | Security Framework
