6 successful organizations and why they chose our technology
Rosy Hunt Content Marketing Specialist
12th April, 2023 | 9 min read
Seven of our most successful customers explain why they chose our data visualization technology....
Rosy Hunt Content Marketing Specialist
12th April, 2023 | 9 min read
Seven of our most successful customers explain why they chose our data visualization technology....
Corey Lanum Chief Product Evangelist
4th April, 2023 | 14 min read
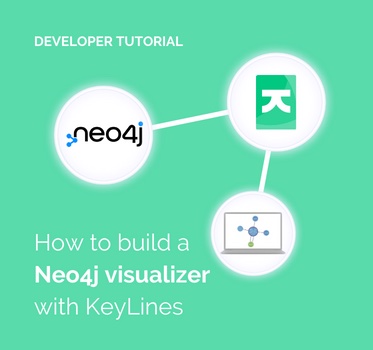
In this tutorial for JavaScript developers, I’ll demonstrate how to build a Neo4j visualizer with our graph...

Christian Miles VP of Sales
29th March, 2023 | 13 min read
If I were to write about every challenge facing senior managers in the tech industry right now, this article would...
Bonney O'Hanlon Product Manager
21st March, 2023 | 3 min read
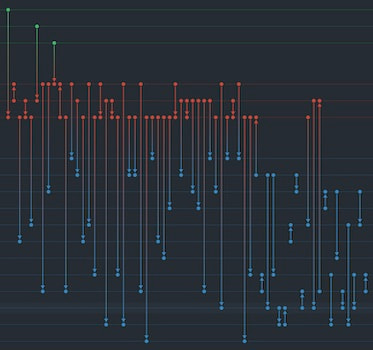
The latest version of our timeline visualization toolkit is available now. KronoGraph 2.3 delivers greater...
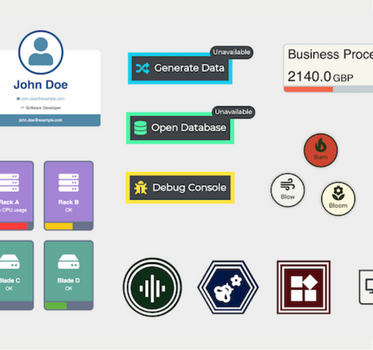
Kevin Naughten Senior Product Manager
14th March, 2023 | 7 min read
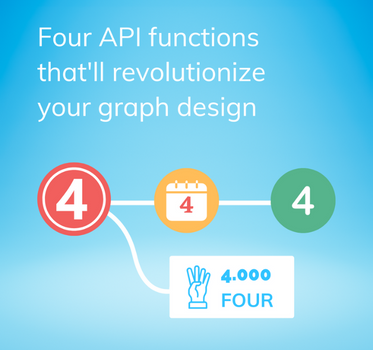
We demonstrate some of the game-changing customization features available in the latest updates to our graph...
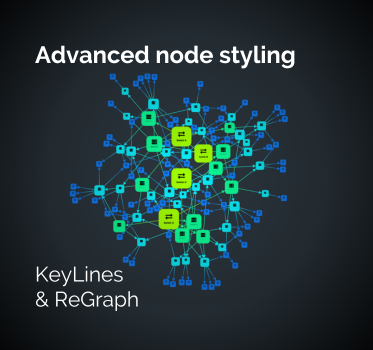
Dan Williams Chief Product Officer
7th March, 2023 | 3 min read
KeyLines and ReGraph deliver an advanced level of node styling capability and almost limitless customization...
Rosy Hunt Content Marketing Specialist
2nd March, 2023 | 5 min read
The latest major releases of our graph visualization toolkits empower software product designers to realize their...

Catherine Kearns Content Strategist & Team Lead
28th February, 2023 | 10 min read
We’ve blogged before about the benefits of graph visualization SDKs over open source graph libraries. There are...
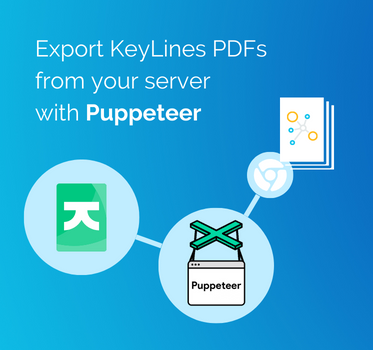
Christian Lentfort Developer
14th February, 2023 | 11 min read
In this Puppeteer tutorial, developer Christian Lentfort shows you how to create a simple server application using...
Registered in England and Wales with Company Number 07625370 | VAT Number 113 1740 61
6-8 Hills Road, Cambridge, CB2 1JP. All material © Cambridge Intelligence .
Privacy Policy | Security Framework
