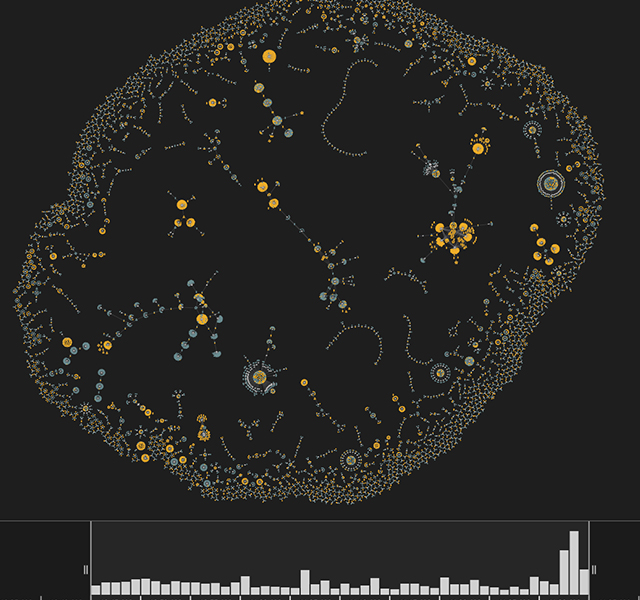
PageRank centrality & EigenCentrality
Andrew Disney Marketing Director
14th January, 2020 | 5 min read
PageRank centrality & EigenCentrality are powerful graph functions in our visualization technology. Discover...
Andrew Disney Marketing Director
14th January, 2020 | 5 min read
PageRank centrality & EigenCentrality are powerful graph functions in our visualization technology. Discover...

Gizem Unal Head of Marketing
13th January, 2020 | 9 min read
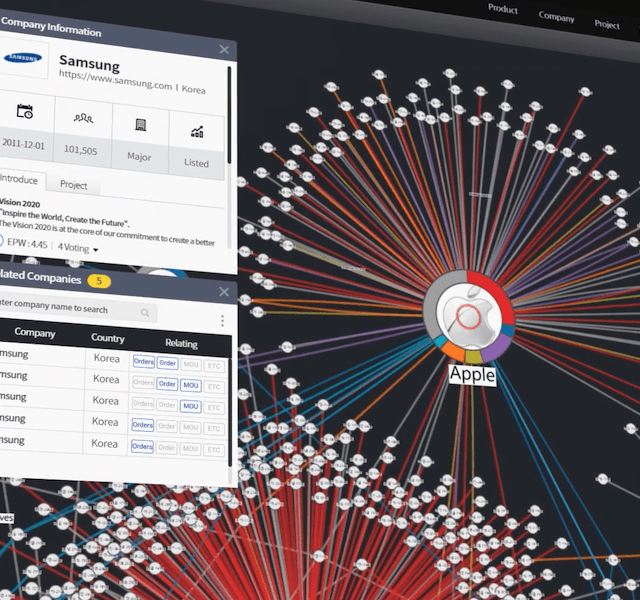
Our graph visualization technology is a particularly good fit for large, complex networks stored as knowledge...
Andrew Disney Marketing Director
7th January, 2020 | 8 min read
Are you trying to create effective data models for graph visualizations? Do your users find insight in connected...
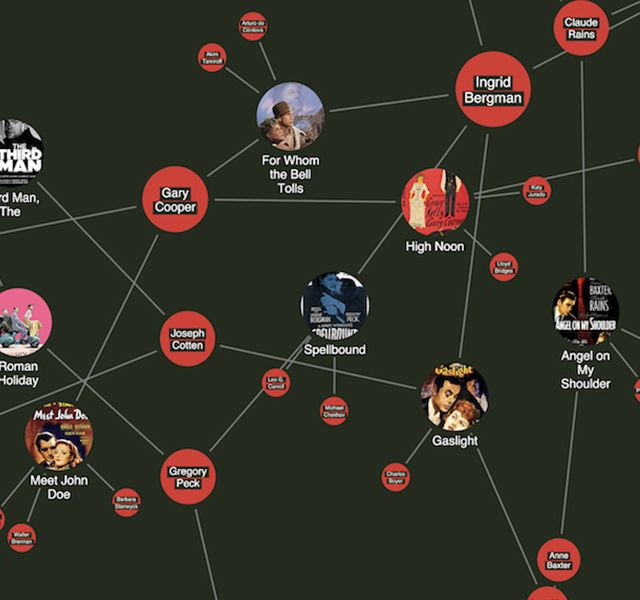
Andrew Disney Marketing Director
2nd January, 2020 | 5 min read
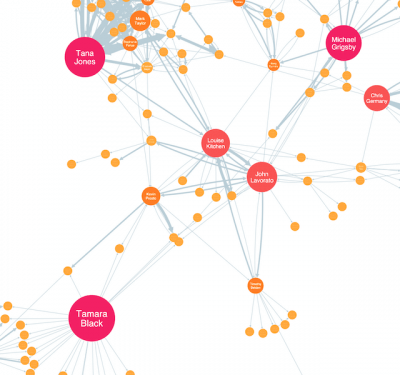
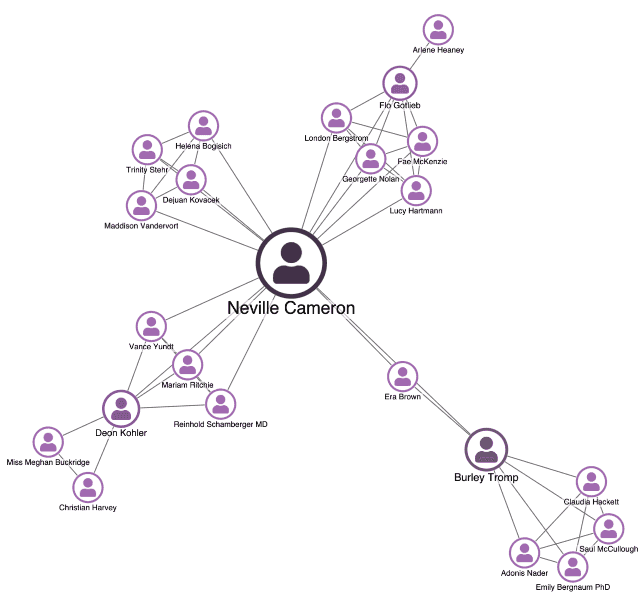
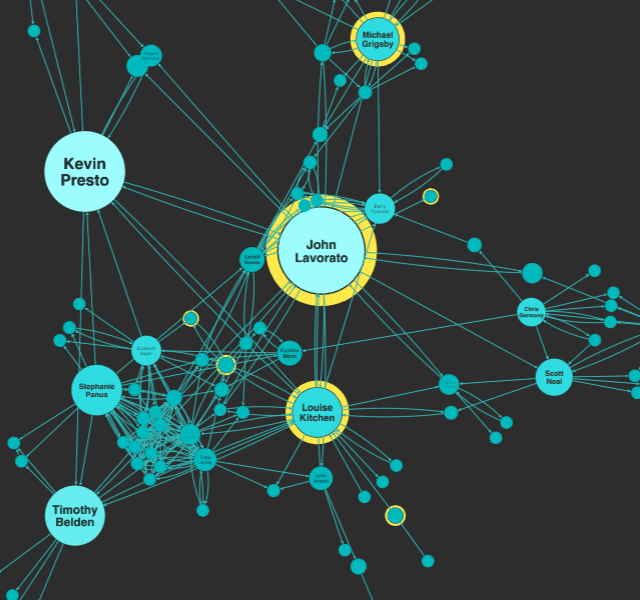
Here’s everything you need to get started with centrality measures: what they are, what they tell us and...
Dan Williams Chief Product Officer
16th December, 2019 | 7 min read
When you visualize data from spreadsheets and relational databases, how do you prevent the ‘snowstorm’...
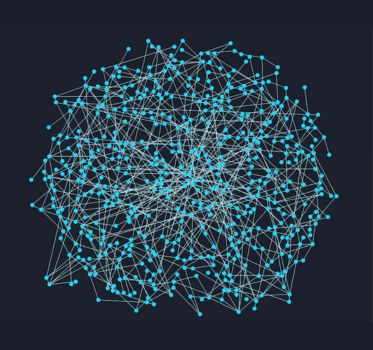
Dan Williams Chief Product Officer
25th November, 2019 | 6 min read
Learn how to tackle the hairballs in your graph visualizations, where nodes and links are so densely connected you...
Christian Miles VP of Sales
21st October, 2019 | 9 min read
We show how quickly and easily you can use GRANDstack and ReGraph to create powerful React Neo4j visualization...
Andrew Disney Marketing Director
30th September, 2019 | 4 min read
This case study looks at how South Korean startup, Illunex, combines AI with KeyLines’ graph visualization...
Rosy Hunt Content Marketing Specialist
13th September, 2019 | 10 min read
Find out how to use network visualization to make sense of cryptocurrency transaction patterns, focusing on...
Registered in England and Wales with Company Number 07625370 | VAT Number 113 1740 61
6-8 Hills Road, Cambridge, CB2 1JP. All material © Cambridge Intelligence .
Privacy Policy | Security Framework
