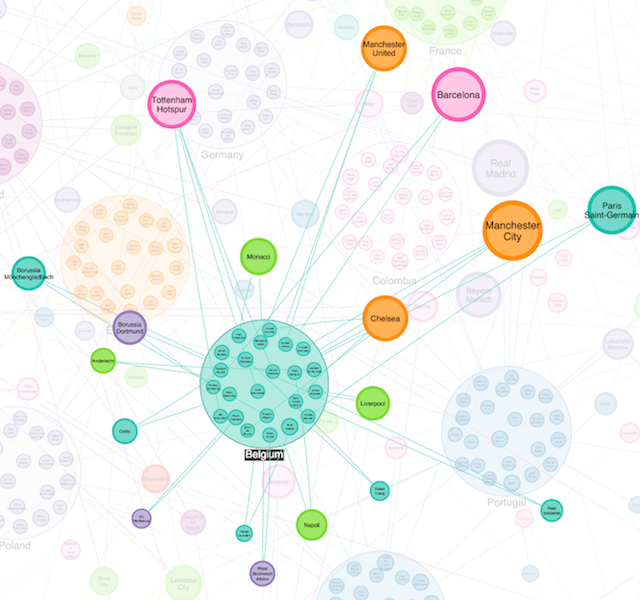
Visualizing the 2018 World Cup
Dan Williams Chief Product Officer
25th June, 2018 | 3 min read
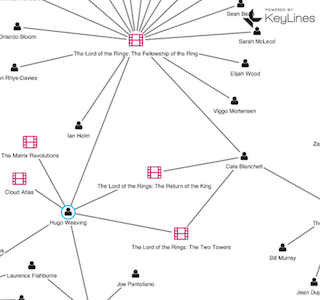
With the World Cup in full swing, we thought it would be fun to visualize it using our graph visualization...
Dan Williams Chief Product Officer
25th June, 2018 | 3 min read
With the World Cup in full swing, we thought it would be fun to visualize it using our graph visualization...
Christian Miles VP of Sales
18th June, 2018 | 5 min read
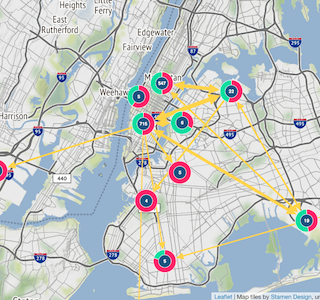
In this blog, we use a New York taxi cab database to show how graph visualization can be useful when working with...
Andrew Disney Marketing Director
18th May, 2018 | 4 min read
Discover the benefits of graph visualization and why it should be a core part of your web application – it’s...

Dan Williams Chief Product Officer
16th April, 2018 | 6 min read
We look at three high-level questions you should consider when choosing a graph visualization partner, to make...
Andrew Disney Marketing Director
9th April, 2018 | 5 min read
Discover how trust-hub’s Privacy Lens app and KeyLines-powered graph visualizations help organizations map,...
Dan Williams Chief Product Officer
12th March, 2018 | 5 min read
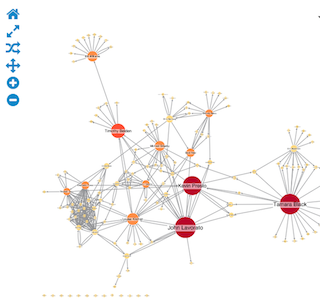
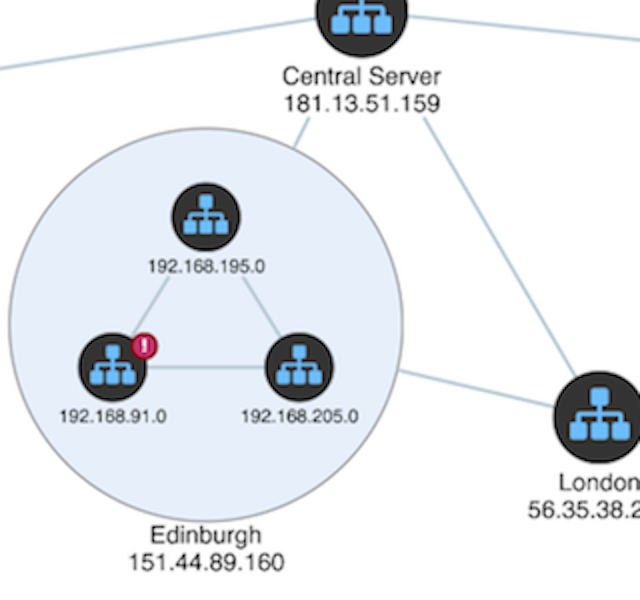
In this blog post, we’ll show you how network visualization can make alert detection and investigation more...

Dan Williams Chief Product Officer
9th February, 2018 | 6 min read
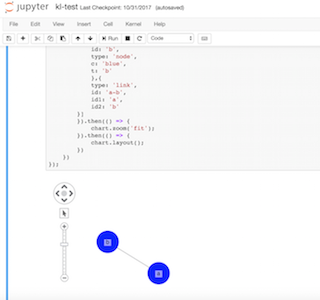
In this blog post we explore open source code libraries versus commercial SDKs to show why Cambridge...
Duncan Grant Sales Engineer
8th January, 2018 | 5 min read
Sharing intelligence is a key part of every graph analysis workflow. Once your connected data has been explored,...
Andrew Disney Marketing Director
4th December, 2017 | 5 min read
A quick history lesson Back in February 2015, Aurelius – the organization behind the Titan graph database...
Registered in England and Wales with Company Number 07625370 | VAT Number 113 1740 61
6-8 Hills Road, Cambridge, CB2 1JP. All material © Cambridge Intelligence .
Privacy Policy | Security Framework
