How ReGraph’s powerful performance measures up
Catherine Kearns Content Strategist & Team Lead
16th March, 2020 | 5 min read
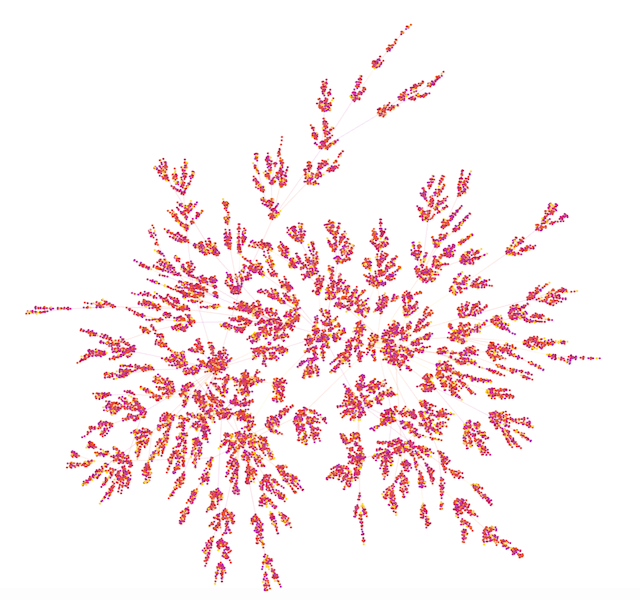
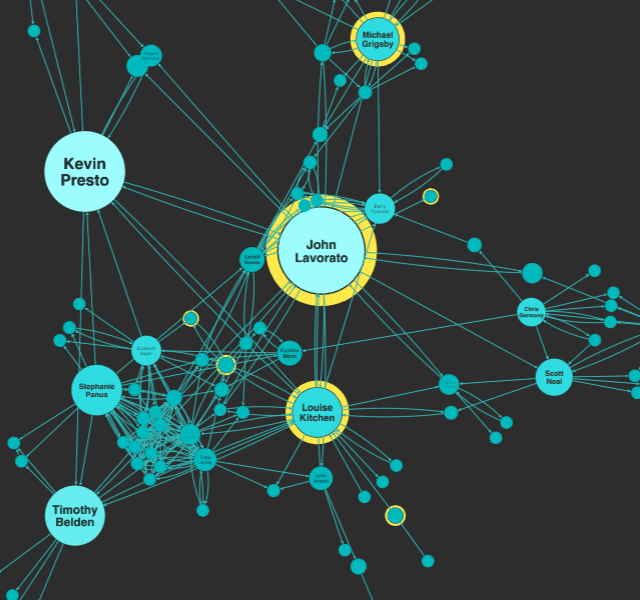
ReGraph’s powerful rendering gives your analysts the quality and speed they expect from a superior graph...
Catherine Kearns Content Strategist & Team Lead
16th March, 2020 | 5 min read
ReGraph’s powerful rendering gives your analysts the quality and speed they expect from a superior graph...
Christian Miles VP of Sales
3rd February, 2020 | 10 min read
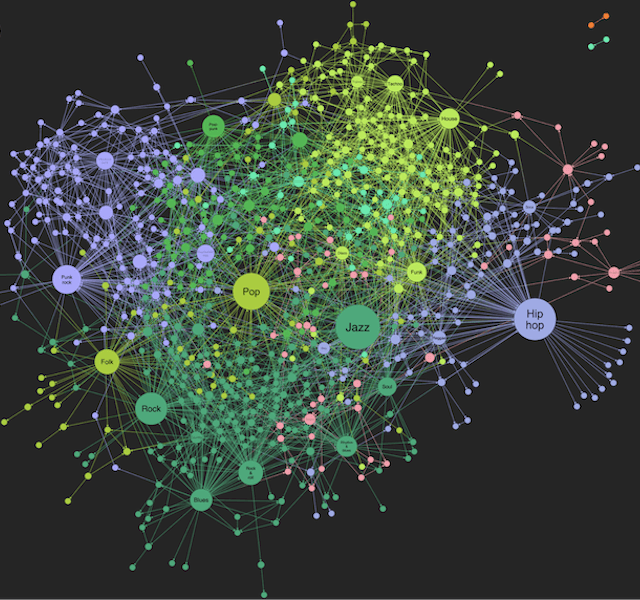
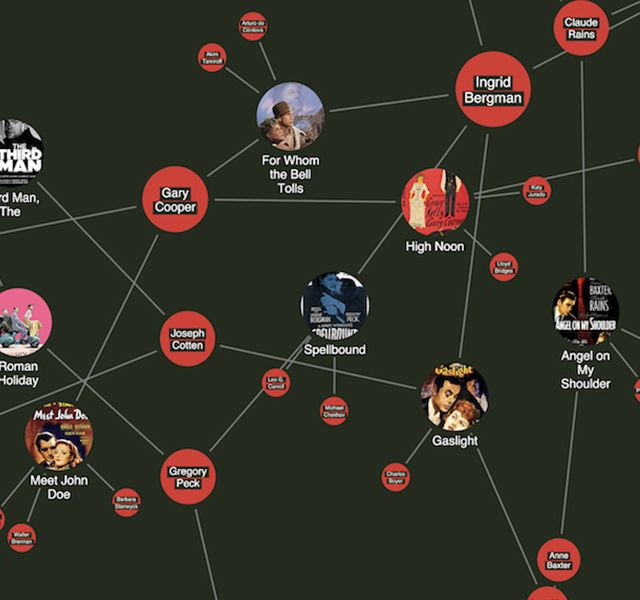
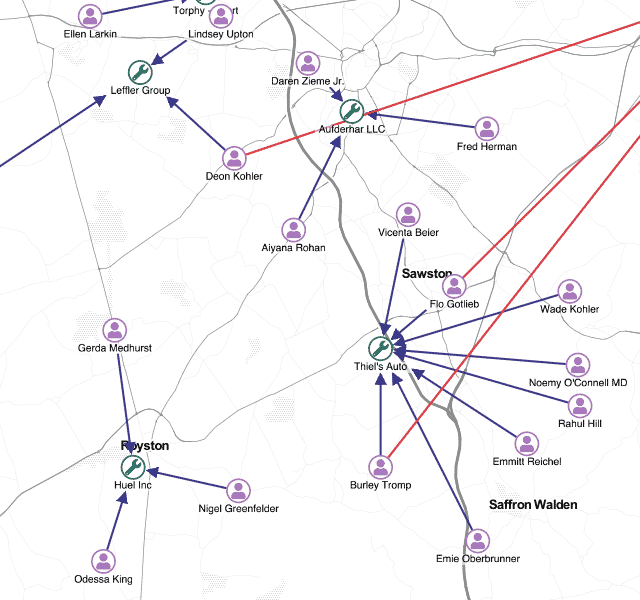
In this developer tutorial, we’ll use SPARQL to query a DBpedia knowledge graph visualization of connections...
Corey Lanum Chief Product Evangelist
23rd January, 2020 | 7 min read
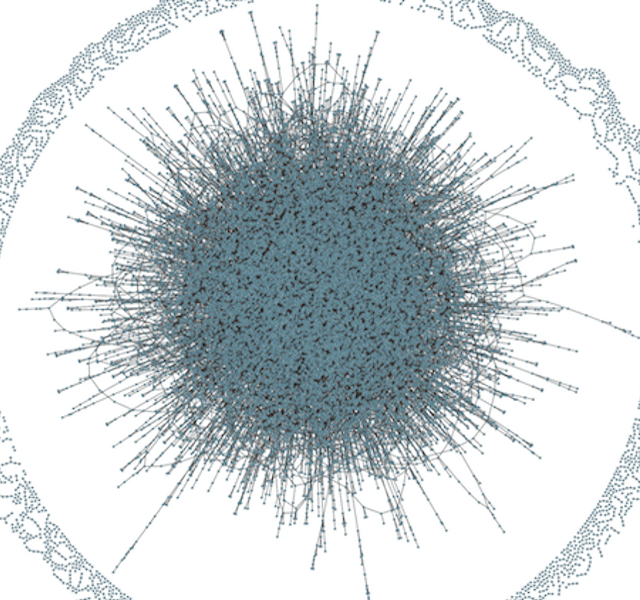
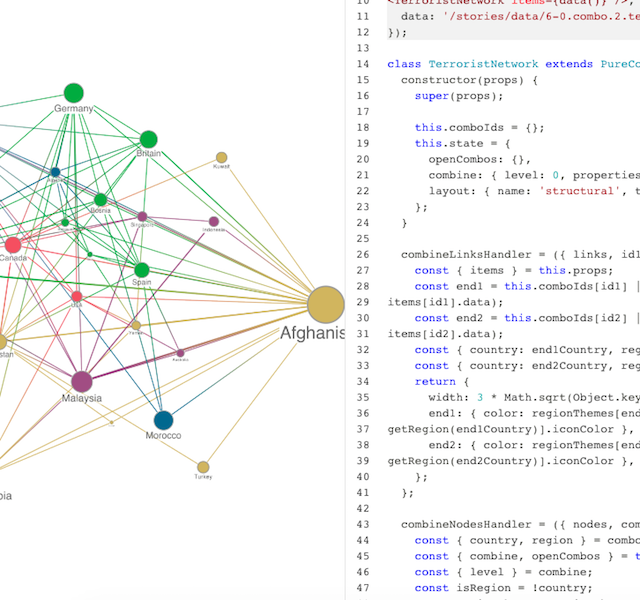
Successful graph visualization at scale: proven strategies to visualize your graph data at scale and still uncover...
Andrew Disney Marketing Director
14th January, 2020 | 5 min read
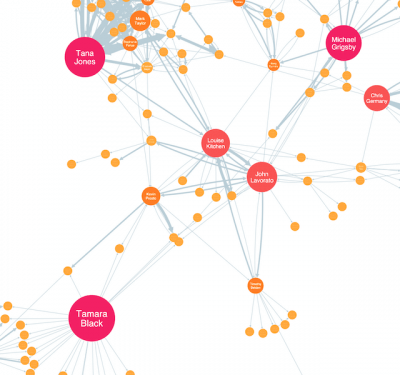
PageRank centrality & EigenCentrality are powerful graph functions in our visualization technology. Discover...
Andrew Disney Marketing Director
2nd January, 2020 | 5 min read
Here’s everything you need to get started with centrality measures: what they are, what they tell us and...
Christian Miles VP of Sales
21st October, 2019 | 9 min read
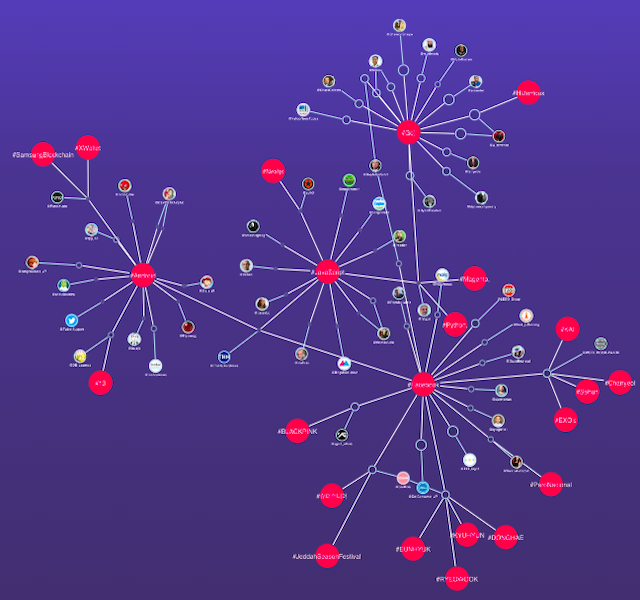
We show how quickly and easily you can use GRANDstack and ReGraph to create powerful React Neo4j visualization...
Kevin Naughten Senior Product Manager
19th August, 2019 | 4 min read
As a product manager, there are few things more satisfying than bringing a new product into the world. So last...
Catherine Kearns Content Strategist & Team Lead
23rd July, 2019 | 2 min read
After a successful Early Access Program, we’re proud to release v1.0 of ReGraph, our graph data visualization...
Kevin Naughten Senior Product Manager
15th July, 2019 | 6 min read
Let’s create visual models that deliver the best user experience (UX). Detailed graph visualizations from an...
Registered in England and Wales with Company Number 07625370 | VAT Number 113 1740 61
6-8 Hills Road, Cambridge, CB2 1JP. All material © Cambridge Intelligence .
Privacy Policy | Security Framework
