Designing simple visual models that users love
Kevin Naughten Senior Product Manager
15th July, 2019 | 6 min read
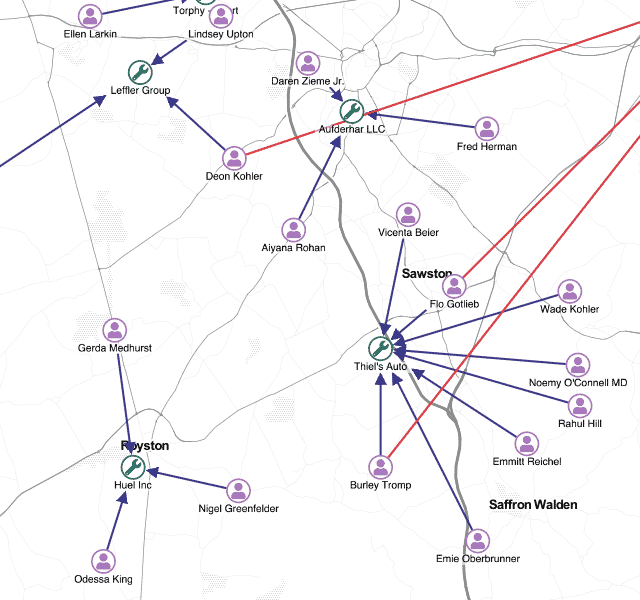
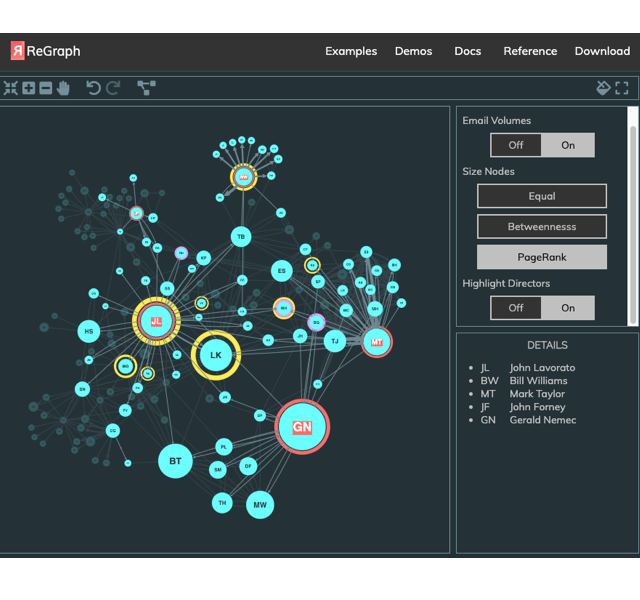
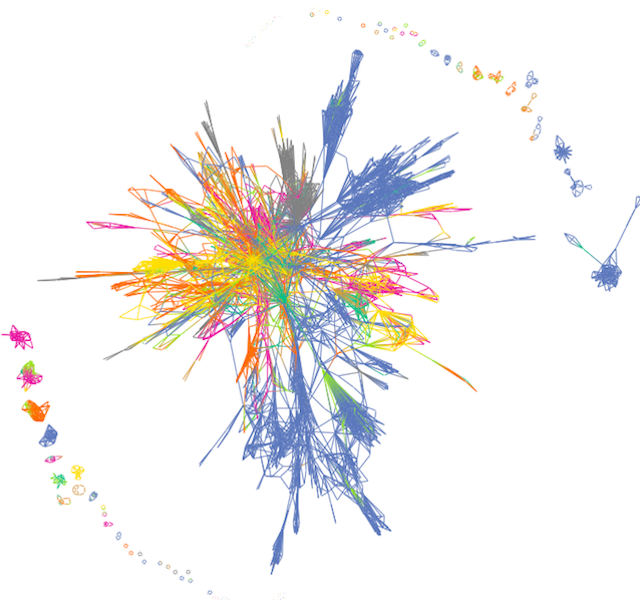
Let’s create visual models that deliver the best user experience (UX). Detailed graph visualizations from an...
Kevin Naughten Senior Product Manager
15th July, 2019 | 6 min read
Let’s create visual models that deliver the best user experience (UX). Detailed graph visualizations from an...
Dan Williams Chief Product Officer
17th June, 2019 | 5 min read
How to build great graph visualization tools that fit seamlessly inside your existing applications, matching...
Christian Miles VP of Sales
3rd June, 2019 | 7 min read
This step-by-step tutorial covers everything you need to get started with ReGraph, the graph visualization toolkit...
Andrew Disney Marketing Director
20th May, 2019 | 5 min read
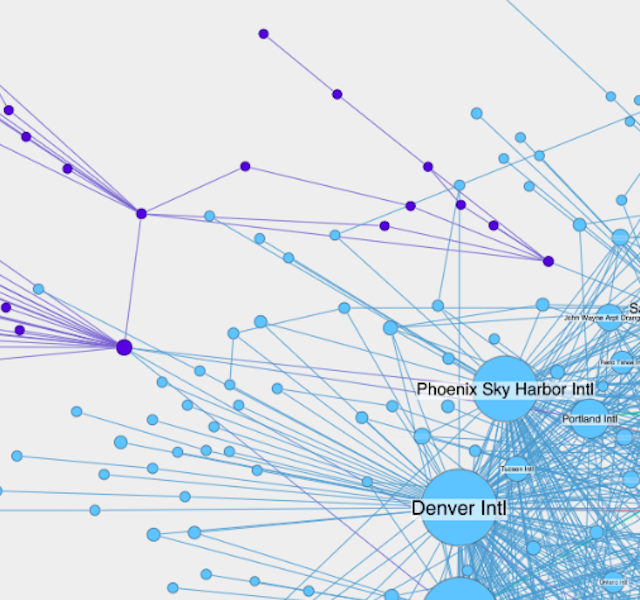
Let’s focus on WebGL – what it is, how it works, and why performance is a key contributor to one of...
Catherine Kearns Content Strategist & Team Lead
7th May, 2019 | 2 min read
Cambridge Intelligence launches an Early Access Program for ReGraph – a brand new graph data visualization...
Christian Miles VP of Sales
18th March, 2019 | 7 min read
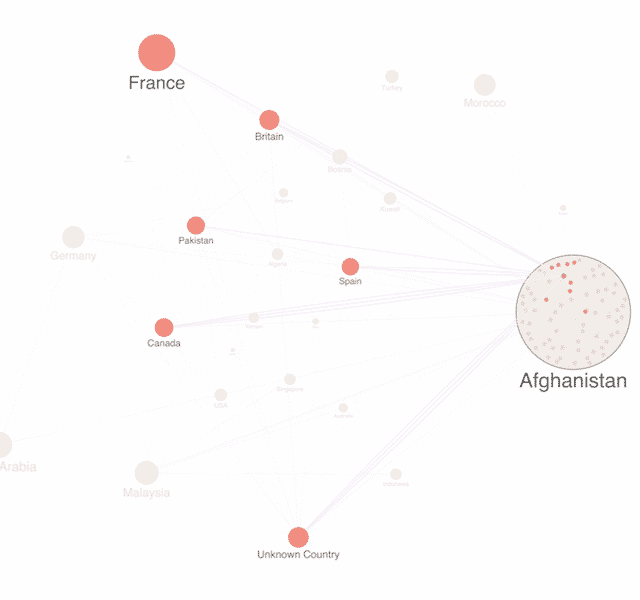
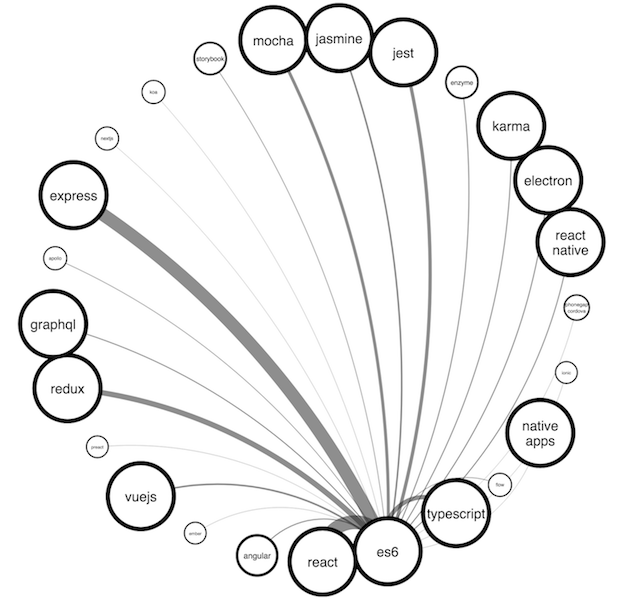
There are so many visualization options to choose from. In this post, we examine the pros and cons of one popular...
Thomas Chan Software Developer
12th February, 2019 | 7 min read
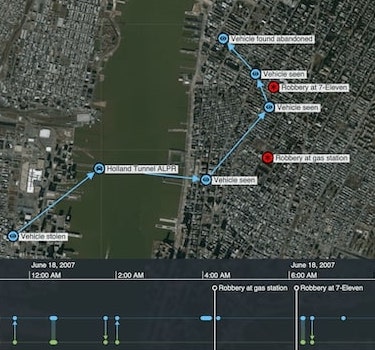
Learn how to integrate KeyLines with Esri’s open source esri-leaflet library to access their ArcGIS mapping...
Catherine Kearns Content Strategist & Team Lead
14th January, 2019 | 6 min read
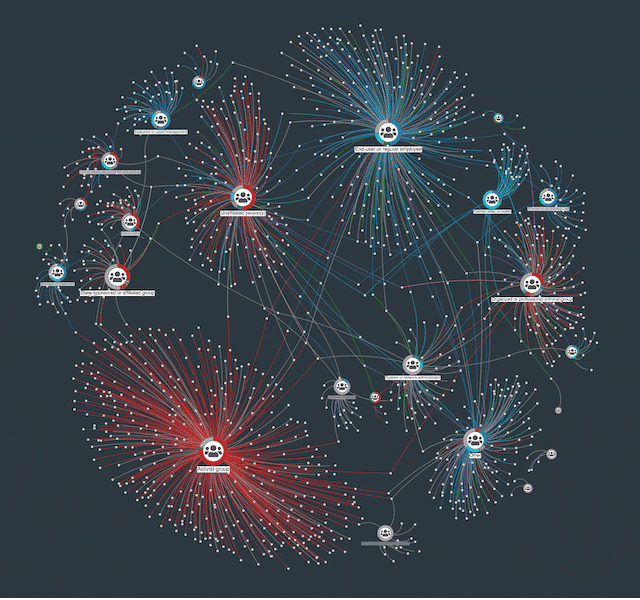
In this blog post, we’ll bring a medieval community to life. Our graph visualizations will help us gain insight...
Andrew Disney Marketing Director
13th November, 2018 | 6 min read
We use the advanced features of our graph visualization technology to test the friendship paradox. We’ll show...
Registered in England and Wales with Company Number 07625370 | VAT Number 113 1740 61
6-8 Hills Road, Cambridge, CB2 1JP. All material © Cambridge Intelligence .
Privacy Policy | Security Framework
