
Bitcoin visualization: analyzing a charity’s success with crypto
Matt Latham Product Manager
10th May, 2022 | 7 min read
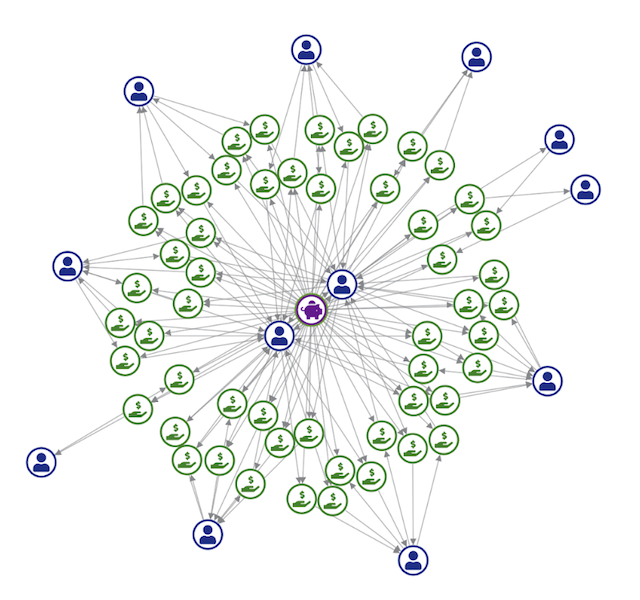
We use bitcoin visualization to track how one charity’s clever cryptocurrency activity boosted donation values...
Matt Latham Product Manager
10th May, 2022 | 7 min read
We use bitcoin visualization to track how one charity’s clever cryptocurrency activity boosted donation values...
Matt Latham Product Manager
4th May, 2022 | 8 min read
Remember the WannaCry ransomware attack? Launched in May 2017, it was one of the most devastating and extensive...
Thomas Chan Software Developer
26th April, 2022 | 8 min read
In this blog post, we use an app built with the ReGraph graph visualization SDK to test the latest Next.js...
Andrew Disney Marketing Director
7th March, 2022 | 8 min read
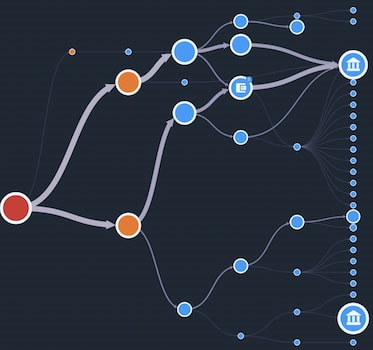
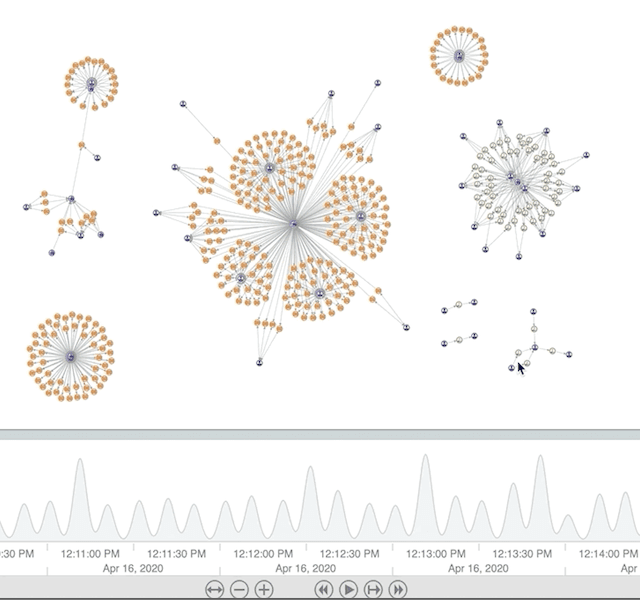
Follow these techniques to build a blockchain analysis tool and make sense of vast & complex blockchain data...
Christian Miles VP of Sales
19th January, 2021 | 10 min read
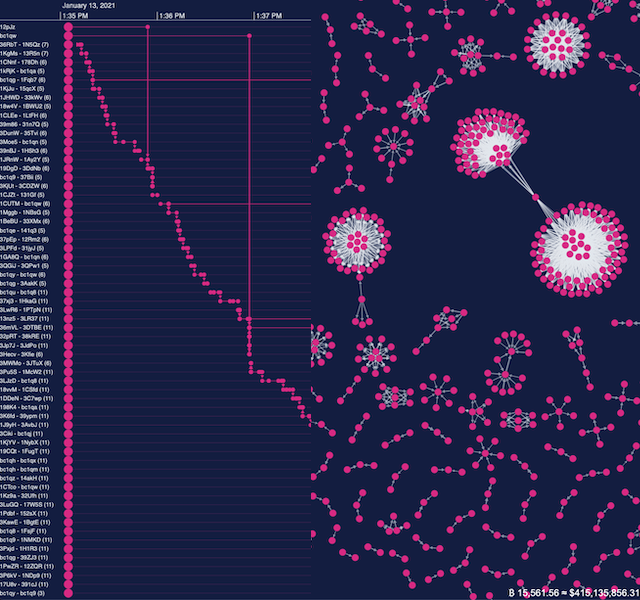
Find out how to use KeyLines and KronoGraph to create your own live, integrated Bitcoin timeline and chart...
Rosy Hunt Content Marketing Specialist
6th July, 2020 | 6 min read
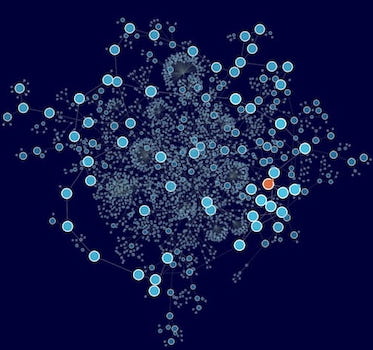
How to use graph visualization and AML techniques to detect money-laundering and high-risk cryptocurrency...
Rosy Hunt Content Marketing Specialist
30th June, 2020 | 6 min read
This blog post explores how US authorities have firmed up their AML regulations in response to the rising...
Rosy Hunt Content Marketing Specialist
13th September, 2019 | 10 min read
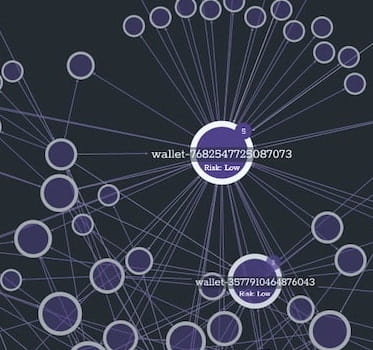
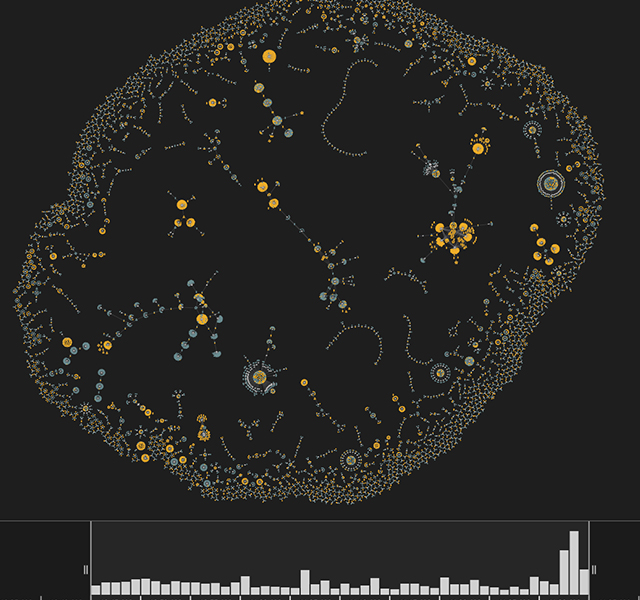
Find out how to use network visualization to make sense of cryptocurrency transaction patterns, focusing on...