
Network digital twin visualization 101
Jan Girman Product Manager
19th November, 2024 | 12 min read
This blog post explores how graph visualization brings digital twins to life. Before joining Cambridge...
Jan Girman Product Manager
19th November, 2024 | 12 min read
This blog post explores how graph visualization brings digital twins to life. Before joining Cambridge...
Kevin Naughten Senior Product Manager
19th December, 2023 | 7 min read
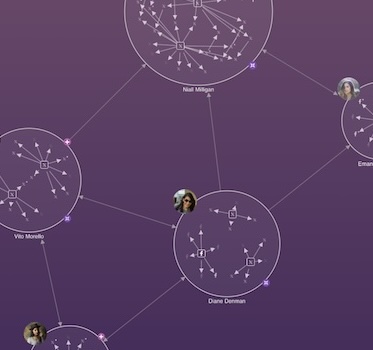
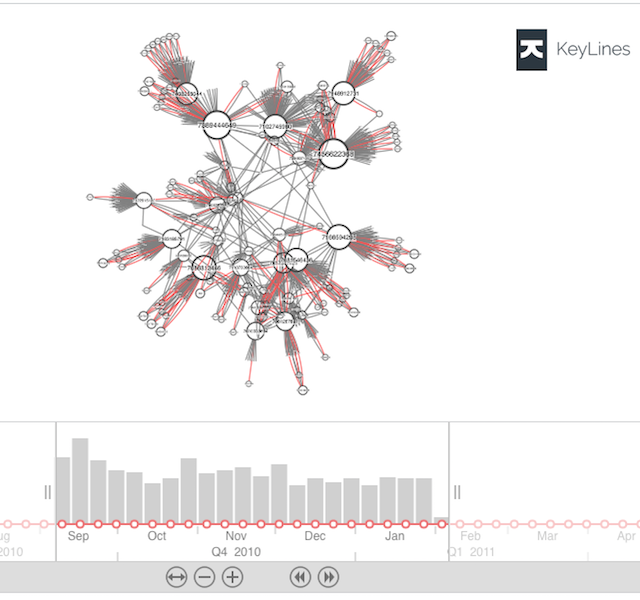
Data overload is a real problem for busy analysts. How do they spot the red flags in a cyber security network? Or...
Rosy Hunt Content Marketing Specialist
20th June, 2022 | 6 min read
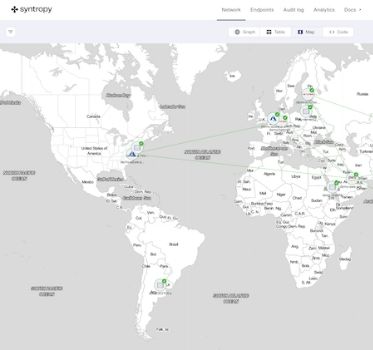
In this blog you’ll see how Syntropy, a global team of web3 pioneers, use our network visualization toolkits to...
Andrew Disney Marketing Director
19th May, 2022 | 6 min read
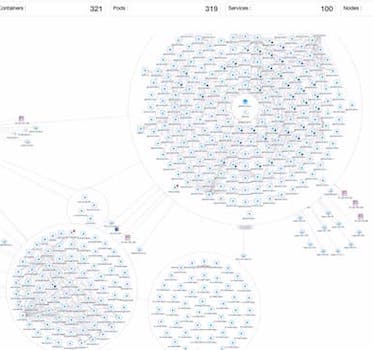
In this blog post, we see how Virtana OpsCruise – a leading modern applications observability platform and...
Christian Miles VP of Sales
4th August, 2020 | 11 min read
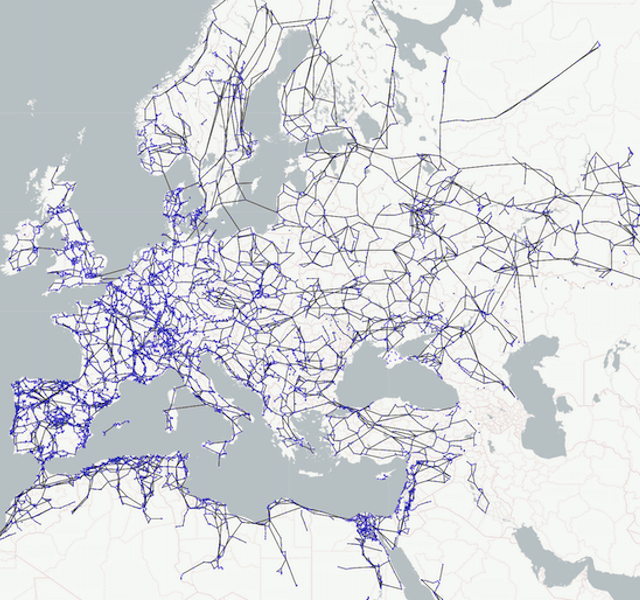
We explore the fascinating world of energy infrastructure by visualizing the network of energy pipelines routing...
Catherine Kearns Content Strategist & Team Lead
3rd December, 2018 | 8 min read
We integrate KeyLines with InfluxDB – a time series database (TSDB) – to see how it can help us...
Dan Williams Chief Product Officer
12th March, 2018 | 5 min read
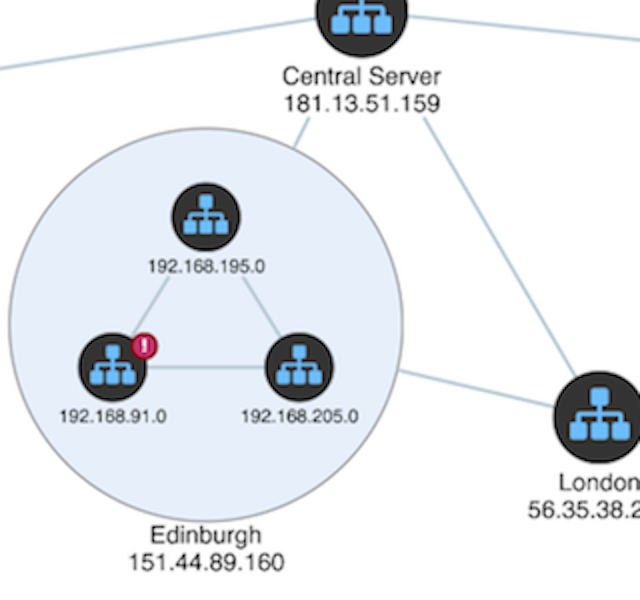
In this blog post, we’ll show you how network visualization can make alert detection and investigation more...