Archive

Browse news, events and blogs from the Cambridge Intelligence team

Empowering people in crisis: Our support for the British Red Cross

Empowering people in crisis: Our support for the British Red Cross

Content Marketing Specialist
14th December, 2023 | 3 min read

As part of our ongoing commitment to making a positive impact on the world, we’ve made a donation of £20,000 to...

Product update: 3 ways to style & declutter graph visualizations

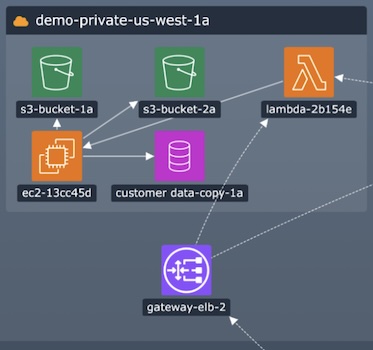
Product update: 3 ways to style & declutter graph visualizations

Product Manager Team Lead
12th December, 2023 | 3 min read

With every version of our KeyLines and ReGraph graph visualization toolkits, we aim to share new features that...

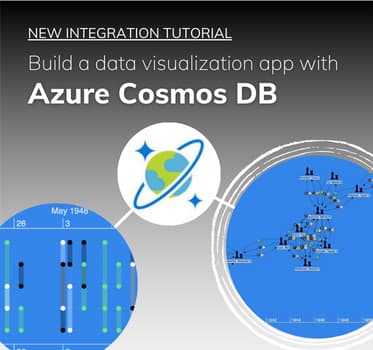
Azure Cosmos DB tutorial for KronoGraph & KeyLines

Azure Cosmos DB tutorial for KronoGraph & KeyLines

Chief Product Evangelist
21st November, 2023 | 19 min read

This Azure Cosmos DB tutorial shows you how to integrate Microsoft’s multi-model database service with our graph...

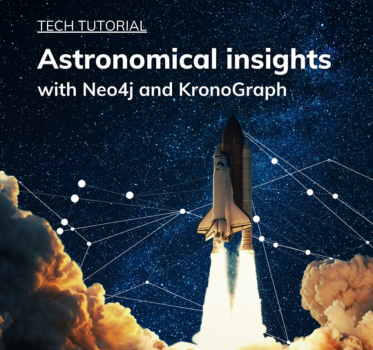
Astronomical insights with Neo4j and KronoGraph

Astronomical insights with Neo4j and KronoGraph

Chief Product Evangelist
14th November, 2023 | 15 min read

In this tutorial, you’ll find out how to use Neo4j and KronoGraph to create an interactive timeline...

Joining forces with Sistemi & Automazione to boost analysis at Italy’s central bank

Joining forces with Sistemi & Automazione to boost analysis at Italy’s central bank

Marketing Director
13th November, 2023 | 2 min read

Together with our partners at Sistemi & Automazione, we’ve secured a tender to provide Italy’s central...

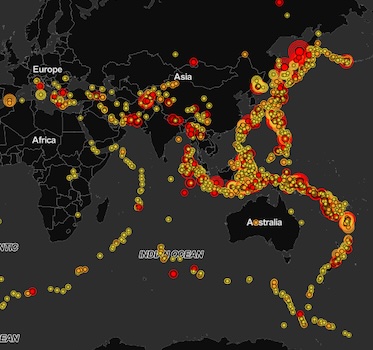
Understanding earthquakes: what map visualizations teach us

Understanding earthquakes: what map visualizations teach us

Software Developer
9th November, 2023 | 8 min read

Analysts rely on our data visualization toolkits to spot hidden patterns in their visualized data. They...

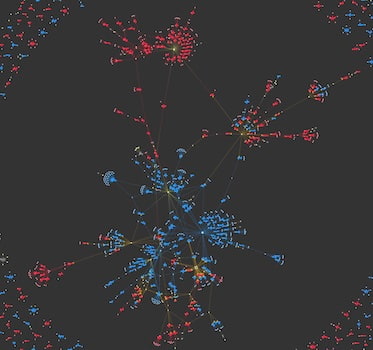
Surprising visual insights from US election campaign data

Surprising visual insights from US election campaign data

Chief Product Evangelist
31st October, 2023 | 6 min read

I use graph visualization to reveal insights in US election campaign data: which orgs donate to both Republican...

Visualizing graph data without a graph database

Visualizing graph data without a graph database

Chief Product Evangelist
25th October, 2023 | 12 min read

What datastore is best for visualizing graph data? Graph databases are often a great fit, but you have more...

How to choose a graph database: we compare 6 favorites

How to choose a graph database: we compare 6 favorites

Marketing Director
19th October, 2023 | 12 min read

If you’ve found this article, the chances are you: Need to build a powerful graph or graph analytics application...

Registered in England and Wales with Company Number 07625370 | VAT Number 113 1740 61
6-8 Hills Road, Cambridge, CB2 1JP. All material © Cambridge Intelligence 2024.
Read our Privacy Policy.