Visualizing graph data without a graph database
Corey Lanum Chief Product Evangelist
25th October, 2023 | 12 min read
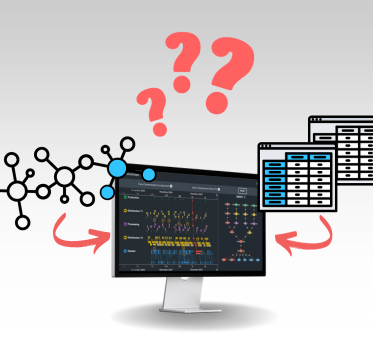
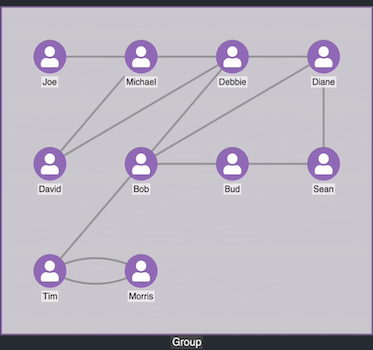
What datastore is best for visualizing graph data? Graph databases are often a great fit, but you have more...
Corey Lanum Chief Product Evangelist
25th October, 2023 | 12 min read
What datastore is best for visualizing graph data? Graph databases are often a great fit, but you have more...
Bonney O'Hanlon Product Manager
17th October, 2023 | 2 min read
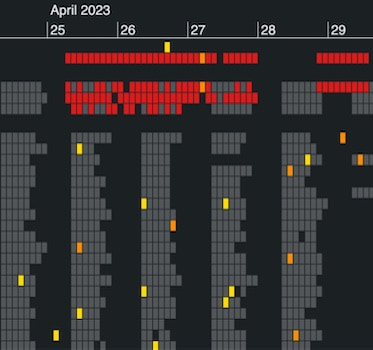
The latest version of KronoGraph, our timeline visualization SDK, includes more ways to customize heatmap cells...
Rosy Hunt Content Marketing Specialist
5th October, 2023 | 2 min read
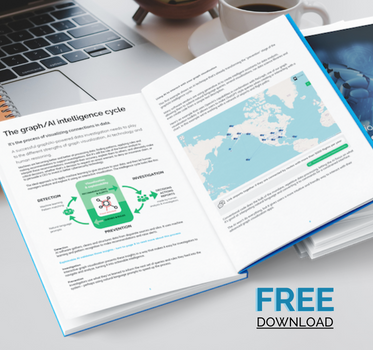
Artificial intelligence promises a positive shift in practice for businesses across domains from cybersecurity,...
Catherine Kearns Content Strategist & Team Lead
3rd October, 2023 | 3 min read
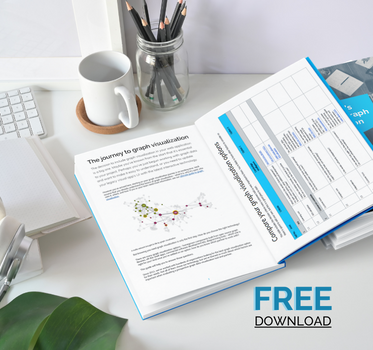
Our free, downloadable buyer’s guide and comparison template helps you to decide which graph visualization...
Rosy Hunt Content Marketing Specialist
29th August, 2023 | 2 min read
We’ve made some changes in senior management, appointing a new CEO and reshaping our leadership team to...
Bonney O'Hanlon Product Manager
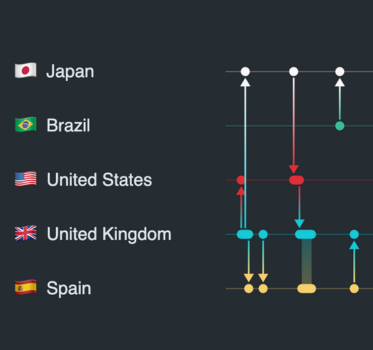
22nd August, 2023 | 3 min read
The latest updates to KronoGraph, our timeline visualization toolkit, demonstrate how to emphasize the most...
Ivan Krushkov Commercial Development Lead
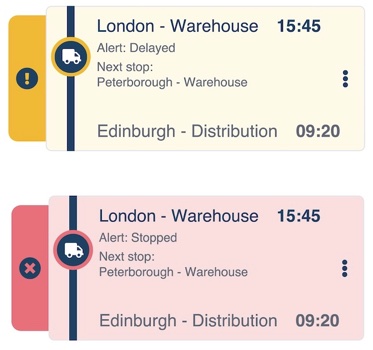
9th August, 2023 | 8 min read
In this post, I show how easy it is to design a visual supply chain that’s customized to your users’ needs,...
Dan Williams Chief Product Officer
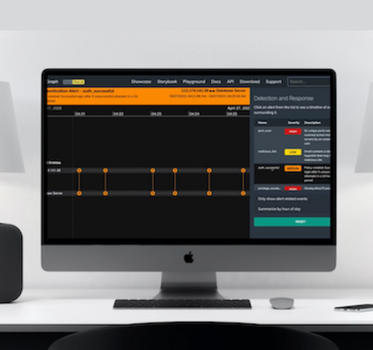
26th July, 2023 | 6 min read
Timeline visualization gives cybersecurity analysts a scalable and intuitive way to investigate threat data, and...
Kevin Naughten Senior Product Manager
18th July, 2023 | 2 min read
KeyLines 7.2 and ReGraph 4.2, the latest versions of our graph visualization toolkits, are available now. The big...
Registered in England and Wales with Company Number 07625370 | VAT Number 113 1740 61
6-8 Hills Road, Cambridge, CB2 1JP. All material © Cambridge Intelligence .
Privacy Policy | Security Framework
