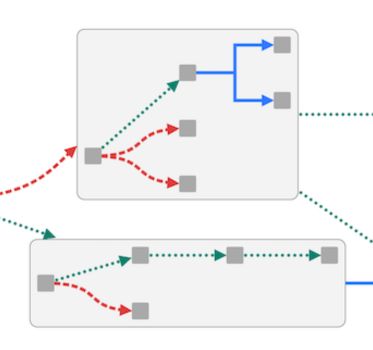
Product update: streamline sequential data with new link options
Courtney Collins Product Manager
3rd December, 2024 | 3 min read
The latest versions of our graph visualization toolkits bring new link options that make it easier than ever to...
Courtney Collins Product Manager
3rd December, 2024 | 3 min read
The latest versions of our graph visualization toolkits bring new link options that make it easier than ever to...

Courtney Collins Product Manager
22nd October, 2024 | 9 min read
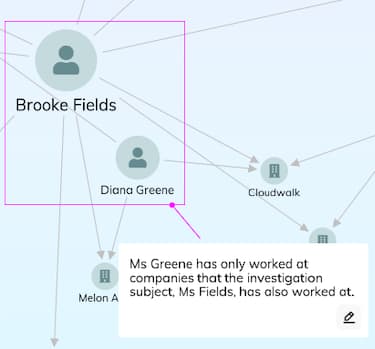
At every stage of an investigation workflow, the analysts need to understand the underlying story – or...
Courtney Collins Product Manager
15th October, 2024 | 4 min read
Get ready to tell the story of your complex data – our latest major releases mark a big leap forward in the...
Dan Williams Chief Product Officer
6th August, 2024 | 8 min read
We look at six key areas of rapid change, and how successful organizations use link analysis techniques to keep...
Courtney Collins Product Manager
17th July, 2024 | 2 min read
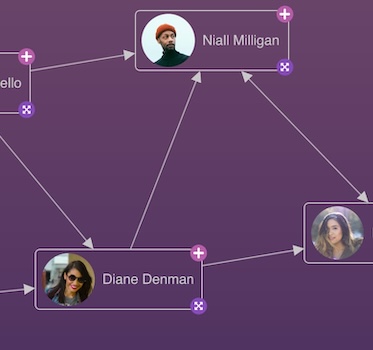
New versions of KeyLines and ReGraph bring more freedom to create custom nodes, greater image & font icon...

Courtney Collins Product Manager
5th March, 2024 | 2 min read
The latest versions of KeyLines and ReGraph, our graph visualization SDKs, include two hotly-anticipated...
Andrew Disney Marketing Director
24th February, 2024 | 8 min read
The basic aim of graph visualization is to help users understand their connected data and find actionable insight....

Catherine Kearns Content Strategist & Team Lead
20th February, 2024 | 8 min read
There’s a lot more to credit card fraud visualization than just spotting disputed transactions. To be effective,...

Kevin Naughten Senior Product Manager
19th December, 2023 | 7 min read
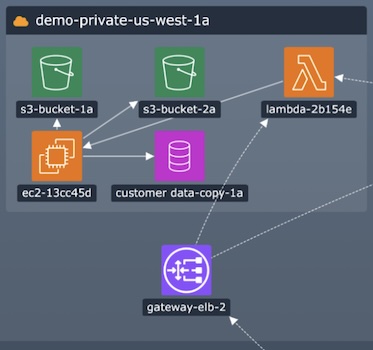
Data overload is a real problem for busy analysts. How do they spot the red flags in a cyber security network? Or...
Registered in England and Wales with Company Number 07625370 | VAT Number 113 1740 61
6-8 Hills Road, Cambridge, CB2 1JP. All material © Cambridge Intelligence .
Privacy Policy | Security Framework
