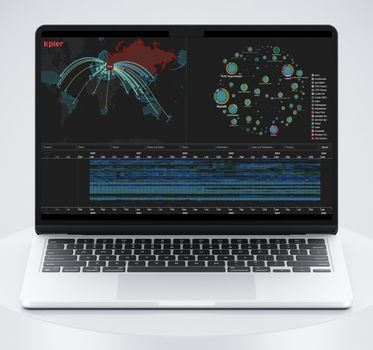
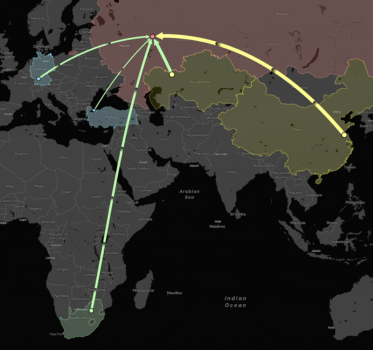
How sanctions reshaped – but didn’t reduce – Russian oil trade
Jan Girman Product Manager
24th February, 2026 | 13 min read
We worked with Kpler, the leading data provider in global trade intelligence, using our visualization SDKs to turn...
Jan Girman Product Manager
24th February, 2026 | 13 min read
We worked with Kpler, the leading data provider in global trade intelligence, using our visualization SDKs to turn...
Jan Girman Product Manager
4th February, 2026 | 10 min read
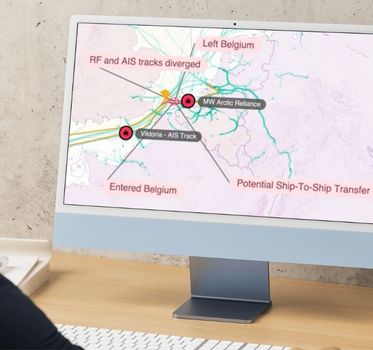
Product manager Jan Girman explores how geospatial fusion is transforming defense and intelligence...
Ivan Krushkov Commercial Development Lead
16th December, 2025 | 12 min read
In this Tailwind CSS tutorial, we’ll show you how to customize your ReGraph app and achieve the designs you want...
Jan Girman Product Manager
10th December, 2025 | 10 min read
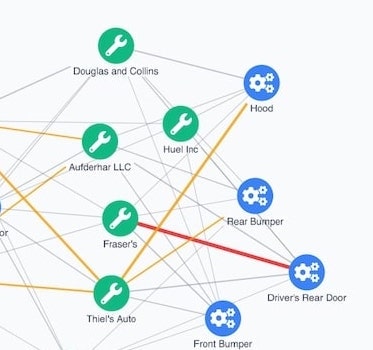
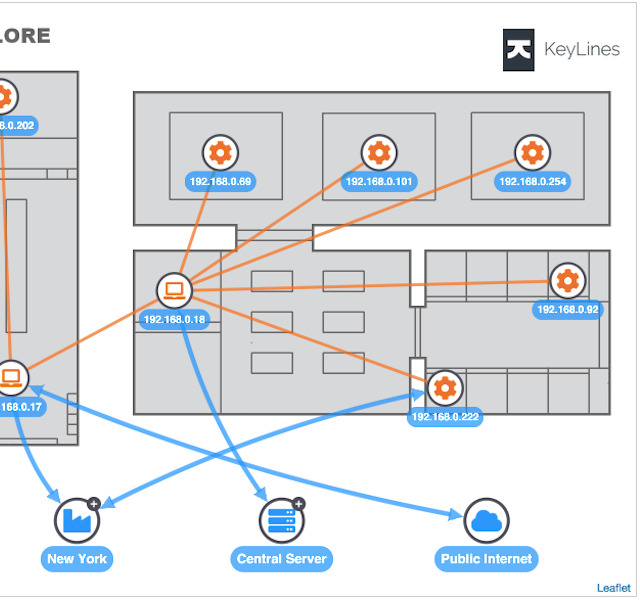
Discover how geospatial network analysis eliminates the compromise between strategic and tactical supply chain...
Dan Williams Chief Product Officer
5th November, 2025 | 6 min read
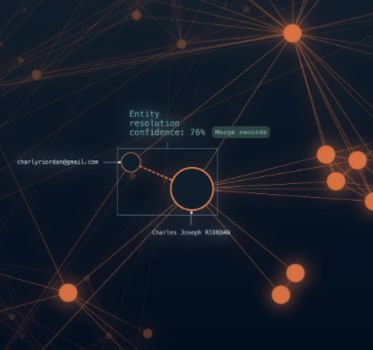
How graph visualization strengthens confidence in AI applications – from making automated processes...
Pete Wood Product Team Lead
29th September, 2025 | 6 min read
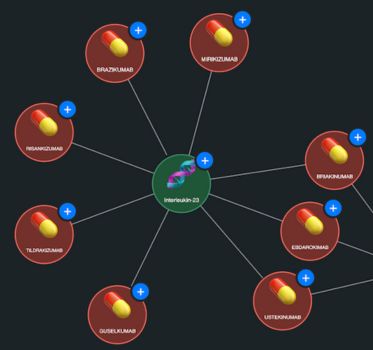
Learn how pharma data visualization with KeyLines reveals hidden drug mechanisms and protein interactions, helping...
Jan Girman Product Manager
12th September, 2025 | 11 min read
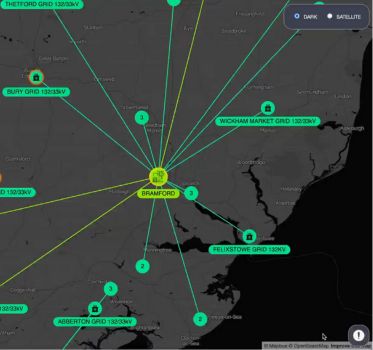
This technical guide to infrastructure network visualization covers timeline and geospatial features, scaling to...
Phil Rodgers Principal Team Lead
20th August, 2025 | 5 min read
This developer tutorial demonstrates how to use images as backdrops. With detailed code examples throughout,...
Ryan Shimmon Commercial Software Developer
12th August, 2025 | 10 min read
This tutorial shows how to integrate data visualization with ChatGPT, OpenAI’s large language model (LLM)...
Registered in England and Wales with Company Number 07625370 | VAT Number 113 1740 61
6-8 Hills Road, Cambridge, CB2 1JP. All material © Cambridge Intelligence .
Privacy Policy | Security Framework
