Graph visualization use cases
Andrew Disney Marketing Director
12th May, 2024 | 11 min read
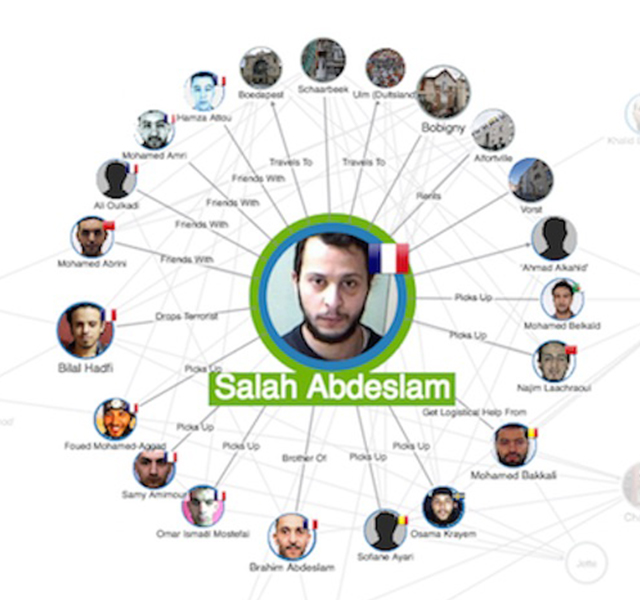
We explore the top real-world data visualization use cases, starting with law enforcement and fraud...
Andrew Disney Marketing Director
12th May, 2024 | 11 min read
We explore the top real-world data visualization use cases, starting with law enforcement and fraud...
Ivan Krushkov Commercial Development Lead
7th May, 2024 | 10 min read
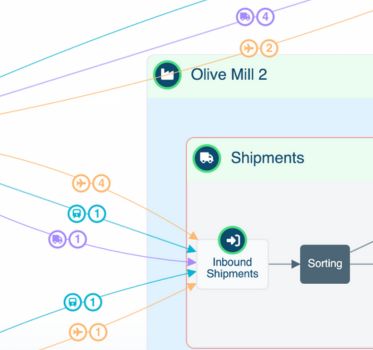
Transform your supply chain processes by integrating graph and timeline visualization with the latest AI-led...
Rosy Hunt Content Marketing Specialist
30th April, 2024 | 4 min read
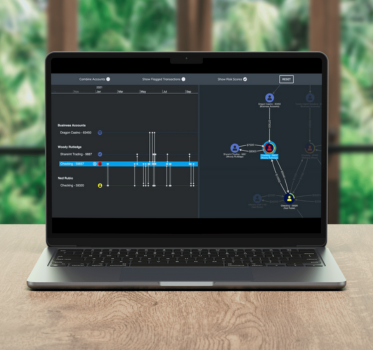
Financial services institutions face a complex set of challenges. Find out how data visualization can...

Paige Hollier Account Executive
11th April, 2024 | 7 min read
This blog post investigates misinformation and disinformation – what it is, why it’s harmful, and what’s...

Catherine Kearns Content Strategist & Team Lead
20th February, 2024 | 8 min read
There’s a lot more to credit card fraud visualization than just spotting disputed transactions. To be effective,...
Dan Williams Chief Product Officer
15th February, 2024 | 8 min read
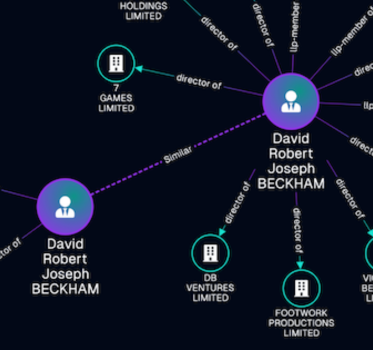
Find out how to use data visualization for compliance, putting analysts in control of their due diligence...

Dan Williams Chief Product Officer
6th February, 2024 | 8 min read
Data visualization and AI are transforming the intelligence cycle. But AI-driven insights need to be tempered by...

Andrew Disney Marketing Director
30th January, 2024 | 8 min read
Enterprise fraud management, powered by the visualization-AI intelligence cycle from fraud detection to...

Thomas Chan Software Developer
16th January, 2024 | 8 min read
In this blog post, I show how to use data visualization and AI in a healthcare fraud detection application that...
Registered in England and Wales with Company Number 07625370 | VAT Number 113 1740 61
6-8 Hills Road, Cambridge, CB2 1JP. All material © Cambridge Intelligence .
Privacy Policy | Security Framework
