
How link analysis for AML powers successful compliance
Catherine Kearns Content Strategist & Team Lead
9th January, 2024 | 8 min read
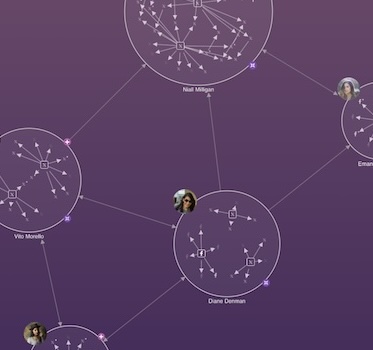
When it comes to combating money laundering, link analysis and AML go hand in hand. In this blog post, we’ll see...
Catherine Kearns Content Strategist & Team Lead
9th January, 2024 | 8 min read
When it comes to combating money laundering, link analysis and AML go hand in hand. In this blog post, we’ll see...
Kevin Naughten Senior Product Manager
19th December, 2023 | 7 min read
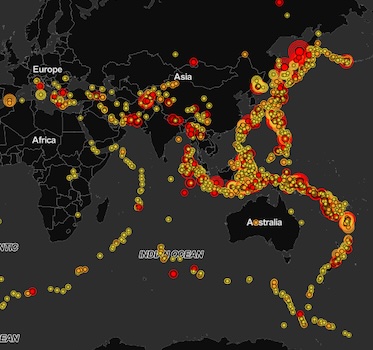
Data overload is a real problem for busy analysts. How do they spot the red flags in a cyber security network? Or...

Andrew Disney Marketing Director
13th November, 2023 | 2 min read
Together with our partners at Sistemi & Automazione, we’ve secured a tender to provide Italy’s central...
Khadeja Sajjad Software Developer
9th November, 2023 | 9 min read
Analysts rely on our data visualization toolkits to spot hidden patterns in their visualized data. They...
Rosy Hunt Content Marketing Specialist
5th October, 2023 | 2 min read
Artificial intelligence promises a positive shift in practice for businesses across domains from cybersecurity,...
Ivan Krushkov Commercial Development Lead
9th August, 2023 | 8 min read
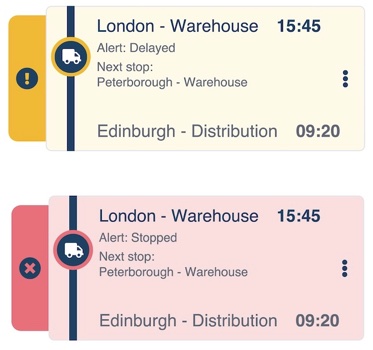
In this post, I show how easy it is to design a visual supply chain that’s customized to your users’ needs,...
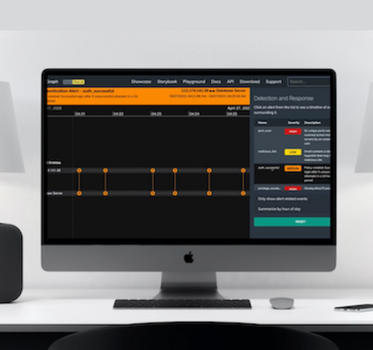
Dan Williams Chief Product Officer
26th July, 2023 | 6 min read
Timeline visualization gives cybersecurity analysts a scalable and intuitive way to investigate threat data, and...
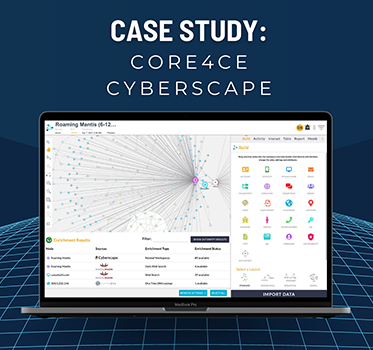
Andrew Disney Marketing Director
21st June, 2023 | 6 min read
See how Core4ce use KeyLines-powered visualizations to help keep critical systems safe from cyber...
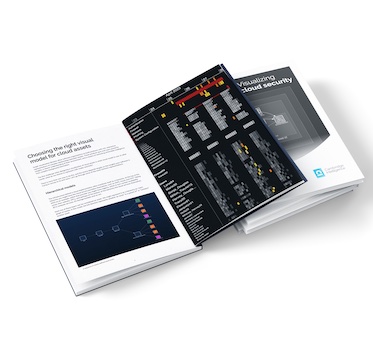
Dan Williams Chief Product Officer
25th May, 2023 | 3 min read
As companies move their digital infrastructure to the cloud, and as Infrastructure as a Service (IaaS) becomes the...
Registered in England and Wales with Company Number 07625370 | VAT Number 113 1740 61
6-8 Hills Road, Cambridge, CB2 1JP. All material © Cambridge Intelligence .
Privacy Policy | Security Framework
