Product update: 3 ways to style & declutter graph visualizations
Kevin Naughten Senior Product Manager
12th December, 2023 | 3 min read
With every version of our KeyLines and ReGraph graph visualization toolkits, we aim to share new features that...
Kevin Naughten Senior Product Manager
12th December, 2023 | 3 min read
With every version of our KeyLines and ReGraph graph visualization toolkits, we aim to share new features that...
Corey Lanum Chief Product Evangelist
31st October, 2023 | 6 min read
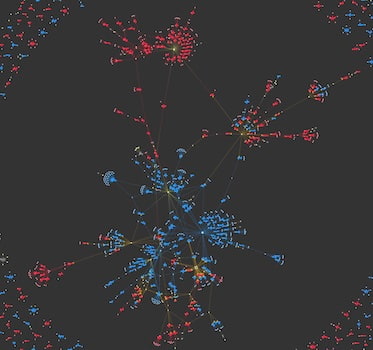
I use graph visualization to reveal insights in US election campaign data: which orgs donate to both Republican...
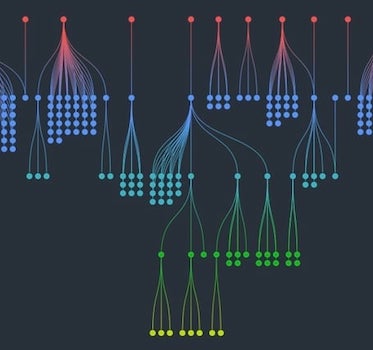
Ivan Krushkov Commercial Development Lead
9th August, 2023 | 8 min read
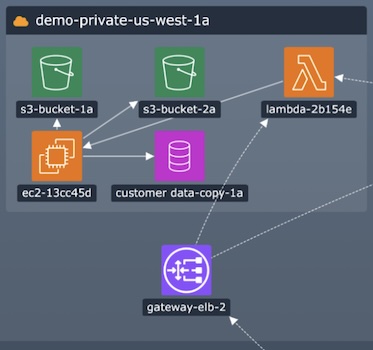
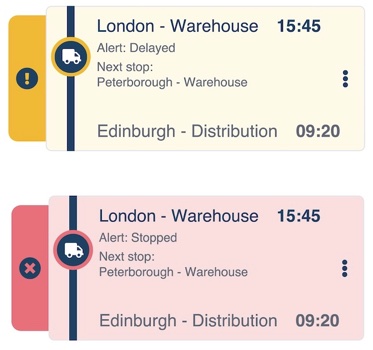
In this post, I show how easy it is to design a visual supply chain that’s customized to your users’ needs,...
Kevin Naughten Senior Product Manager
18th July, 2023 | 2 min read
KeyLines 7.2 and ReGraph 4.2, the latest versions of our graph visualization toolkits, are available now. The big...
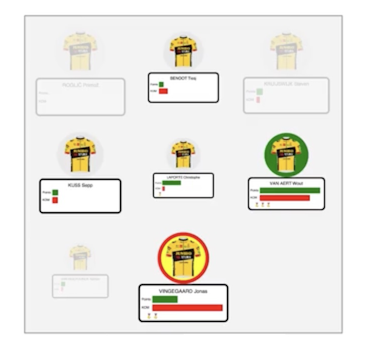
Julia Robson Principal Team Lead
28th June, 2023 | 10 min read
On Saturday 24th June 2023, I set off from Bilbao, Spain, to ride the Tour de France route with Le Loop. In the...
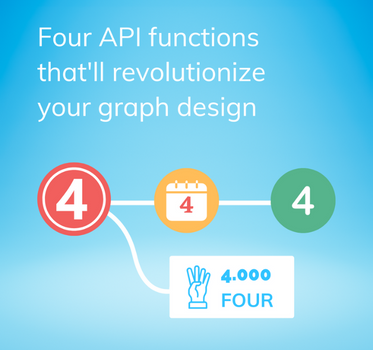
Kevin Naughten Senior Product Manager
30th May, 2023 | 3 min read
KeyLines 7.1 & ReGraph 4.1 feature big performance gains and greater flexibility for our popular sequential...
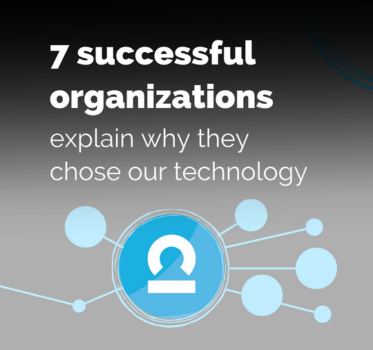
Rosy Hunt Content Marketing Specialist
12th April, 2023 | 9 min read
Seven of our most successful customers explain why they chose our data visualization technology....
Kevin Naughten Senior Product Manager
14th March, 2023 | 7 min read
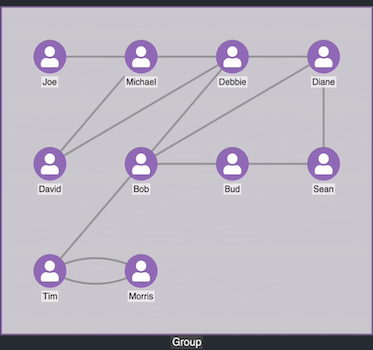
We demonstrate some of the game-changing customization features available in the latest updates to our graph...
Dan Williams Chief Product Officer
7th March, 2023 | 3 min read
KeyLines and ReGraph deliver an advanced level of node styling capability and almost limitless customization...
Registered in England and Wales with Company Number 07625370 | VAT Number 113 1740 61
6-8 Hills Road, Cambridge, CB2 1JP. All material © Cambridge Intelligence .
Privacy Policy | Security Framework
