
Geospatial data visualization with ReGraph and RedwoodJS
Christian Lentfort Developer
13th September, 2022 | 13 min read
We bootstrapped RedwoodJS to ReGraph, our data visualization toolkit for React developers, to build an app that...
Christian Lentfort Developer
13th September, 2022 | 13 min read
We bootstrapped RedwoodJS to ReGraph, our data visualization toolkit for React developers, to build an app that...
Andrew Disney Marketing Director
5th July, 2022 | 7 min read
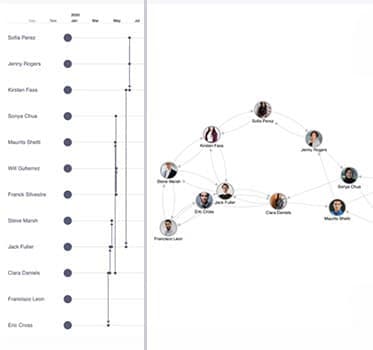
In this blog post, we’ll see how C3 AI – the enterprise AI pioneers – uses graph and timeline...
Rosy Hunt Content Marketing Specialist
20th June, 2022 | 6 min read
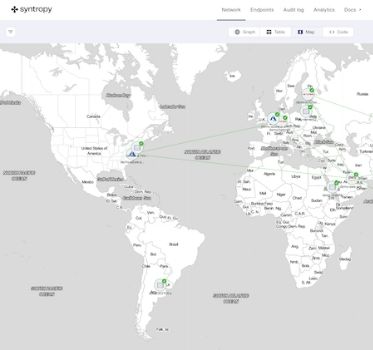
In this blog you’ll see how Syntropy, a global team of web3 pioneers, use our network visualization toolkits to...
Julia Robson Principal Team Lead
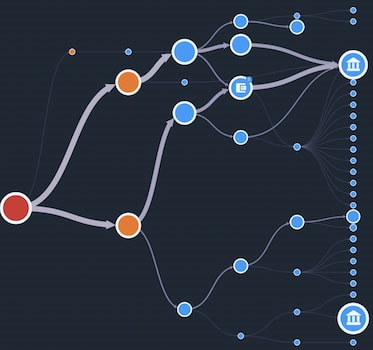
15th June, 2022 | 6 min read
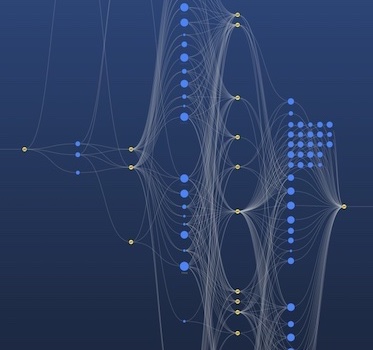
Sequential layout is the best choice for tiered data containing distinct levels of nodes. Find out what makes it...

Dan Williams Chief Product Officer
31st May, 2022 | 2 min read
The latest updates to our graph visualization toolkits include new testing APIs and a live-coding...
Matt Latham Product Manager
10th May, 2022 | 7 min read
We use bitcoin visualization to track how one charity’s clever cryptocurrency activity boosted donation values...
Matt Latham Product Manager
4th May, 2022 | 8 min read
Remember the WannaCry ransomware attack? Launched in May 2017, it was one of the most devastating and extensive...
Thomas Chan Software Developer
26th April, 2022 | 8 min read
In this blog post, we use an app built with the ReGraph graph visualization SDK to test the latest Next.js...

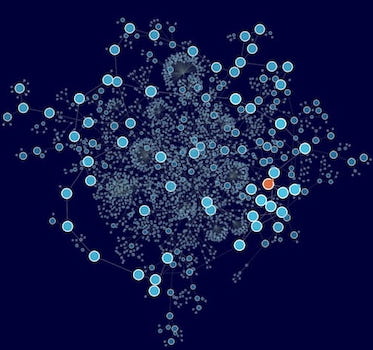
Dan Williams Chief Product Officer
5th April, 2022 | 9 min read
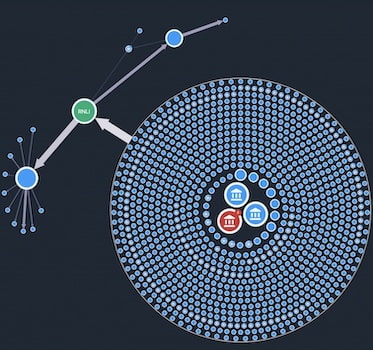
Large network visualization is no problem for our toolkits! We used two of our favorite layouts to map out a...
Registered in England and Wales with Company Number 07625370 | VAT Number 113 1740 61
6-8 Hills Road, Cambridge, CB2 1JP. All material © Cambridge Intelligence .
Privacy Policy | Security Framework
