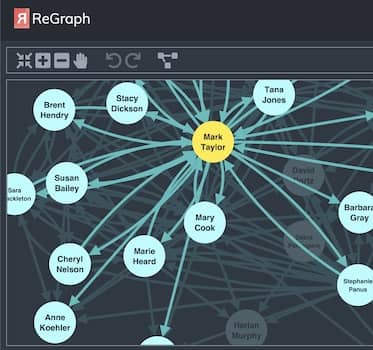
5 essential tips for React developers using ReGraph
Christian Miles VP of Sales
22nd October, 2021 | 11 min read
Discover practical tips for developers using ReGraph, our graph visualization SDK for React, on how to avoid...
Christian Miles VP of Sales
22nd October, 2021 | 11 min read
Discover practical tips for developers using ReGraph, our graph visualization SDK for React, on how to avoid...
Dan Williams Chief Product Officer
31st August, 2021 | 3 min read
Find out what’s new in our latest KeyLines & ReGraph releases. Highlights include improved rectangular...
Christian Miles VP of Sales
3rd August, 2021 | 17 min read
This technical article explores the benefits of React Hooks vs Redux for state management. Is there an effective...
Christian Lentfort Developer
13th July, 2021 | 10 min read
Follow this Styled Components tutorial to build a React graph visualization app with themes from the...
Catherine Kearns Content Strategist & Team Lead
29th June, 2021 | 8 min read
Your essential guide to graph analytics: what they are, why they’re important, and how they provide a deeper...
Kevin Naughten Senior Product Manager
15th June, 2021 | 8 min read
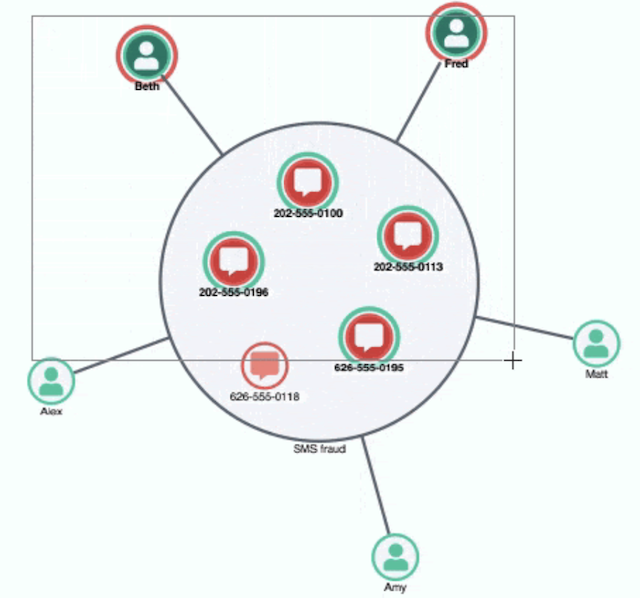
Interactive graph visualization just got easier! These 4 examples show how to customize hover and select behavior...
Dan Williams Chief Product Officer
1st June, 2021 | 8 min read
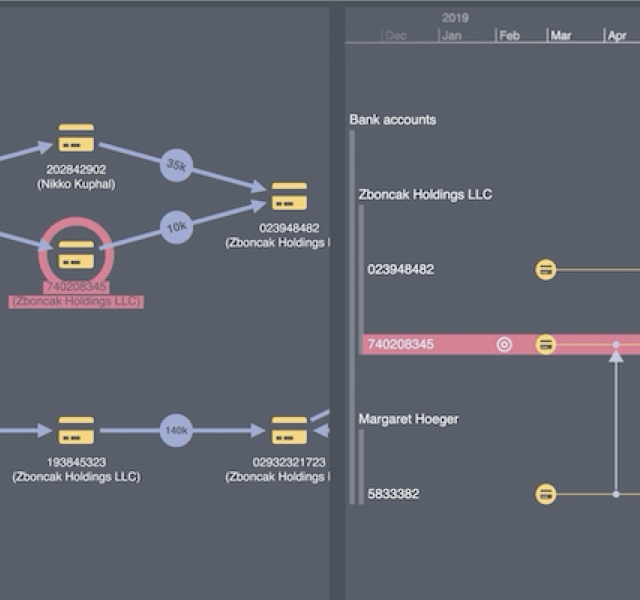
Discover how we use KeyLines & KronoGraph to create flow analysis apps essential for investigating financial...
Catherine Kearns Content Strategist & Team Lead
5th May, 2021 | 5 min read
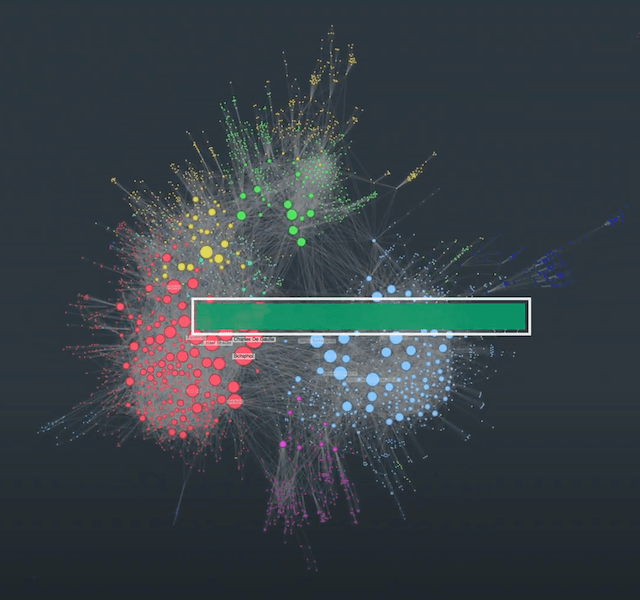
Discover what makes the updated organic layout in our KeyLines and ReGraph toolkits the most powerful, high...
Matt Michel Developer
6th April, 2021 | 8 min read
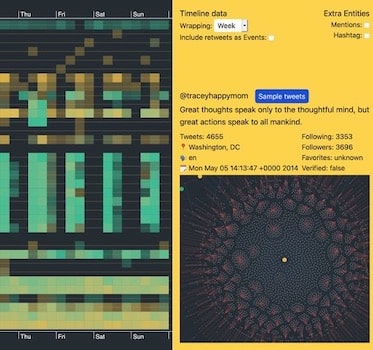
Let’s use KronoGraph and ReGraph to dig deeper into a Twitter data visualization to find patterns of...
Registered in England and Wales with Company Number 07625370 | VAT Number 113 1740 61
6-8 Hills Road, Cambridge, CB2 1JP. All material © Cambridge Intelligence .
Privacy Policy | Security Framework
